B-hIL31/hIL31RA/hOSM/hOSMR mice
| Strain Name | C57BL/6-Il31tm1(IL31)BcgenIl31ratm1(IL31RA)BcgenOsmtm1(OSM)BcgenOsmrtm1(OSMR)Bcgen/Bcgen | Common Name | B-hIL31/hIL31RA/hOSM/hOSMR mice |
| Background | C57BL/6 | Catalog number |
112647 |
| Aliases |
IL31RA (CRL; GPL; CRL3; GLMR; GLM-R; PLCA2; hGLM-R; IL-31RA; PRO21384; zcytoR17) OSMR (OSMRB; PLCA1; IL-31RB; OSMRbeta; IL-31R-beta) |
||

Strain specific analysis of IL31 and IL31RA gene expression in wild-type C57BL/6 mice and homozygous B-hIL31/hIL31RA mice by RT-PCR. Testis was collect from wild-type mice (+/+) and B-hIL31/hIL31RA mice (H/H). Mouse Il31 and Il31ra mRNA were exclusively detectable in wild-type mice. Human IL31 and IL31RA mRNA were exclusively detectable in homozygous B-hIL31/hIL31RA mice, but not in wild-type mice.

Strain specific analysis of OSMR gene expression in wild-type mice and B-hOSM/hOSMR mice. Kidney was collected from wild-type C57BL/6 mice (+/+) and homozygous B-hOSM/hOSMR mice (H/H), and analyzed by RT-PCR and western blot. (A) mRNA expression. Mouse Osmr mRNA was exclusively detectable in wild-type mice. Human OSMR mRNA was exclusively detectable in homozygous B-hOSM/hOSMR mice. (B) Protein expression. The OSMR protein were detected both in wild-type mice and homozygous B-hOSM/hOSMR mice. 293T cells were used as positive control (PC).

Strain specific OSM expression analysis in homozygous B-hOSM/hOSMR mice by ELISA. Spleen were isolated from wild-type C57BL/6 mice (+/+) and homozygous B-hOSM/hOSMR mice (H/H), and stimulated with anti-mouse CD3 and anti-mouse CD28 antibodies in vitro. Cell culture supernatant were collected and analyzed by species-specific OSM ELISA kit. Mouse OSM was detectable in wild-type mice. Human OSM was exclusively detectable in homozygous B-hOSM/hOSMR mice but not in wild-type mice.

hOSM induced IL-6 secretion is blockade by anti-hOSMR antibody in MEFs of homozygous B-hOSM/hOSMR mice. Mouse embryonic fibroblasts (MEFs) were derived from either C57BL/6 mice or B-hOSM/hOSMR mice, and stimulated with different concentrations of mOSM (0-100ng/mL) or hOSM (0-1000ng/mL) for 24h. Supernatants from each well were collected and analyzed for IL-6 expression by ELISA. (A) In the MEFs of C57BL/6 mice, IL-6 can be induced by mOSM in a dose-dependent manner, but not by hOSM. It demonstrates that hOSM can’t be recognized by mouse receptor. (B) In the MEFs of B-hOSM/hOSMR mice, hOSM can induce IL-6 secretion, and the function can be blocked by anti-hOSMR antibodies (in house). The results show that the OSMR signaling function was not influenced by gene humanization. Cells were incubated with antibodies (10μg/mL) for 30 minutes, and stimulated with hOSM.

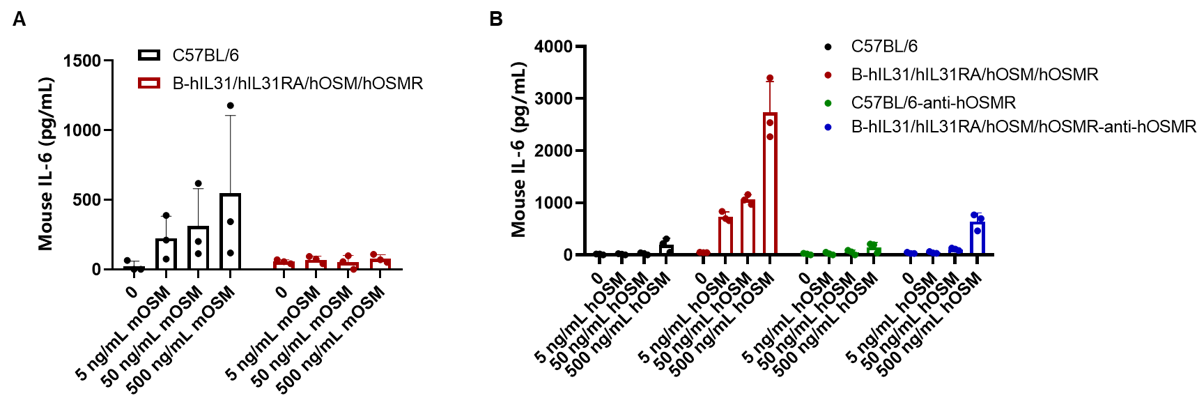
OSM-induced IL-6 is reduced by anti-hOSMR antibody in homozygous B-hIL31/hIL31RA/hOSM/hOSMR mice. Lung fibroblasts derived from either C57BL/6 mice or B-hIL31/hIL31RA/hOSM/hOSMR mice were plated at 15,000 cells/well in 96-well plates and stimulated with indicated concentrations of mOSM or hOSM (0-500 ng/mL) for 24 h, then cell culture supernatants were collected for ELISA analysis of IL-6. (A) rmOSM induced IL-6 expressions in wild-type C57BL/6 mice with dose-dependent manner, but not in homozygous mice. (B) rhOSM induced IL-6 expressions in homozygous mice with dose-dependent manner, but not in wild-type mice. Meanwhile, the secretion of IL6 can be blocked by anti-hOSMR antibodies (in house)

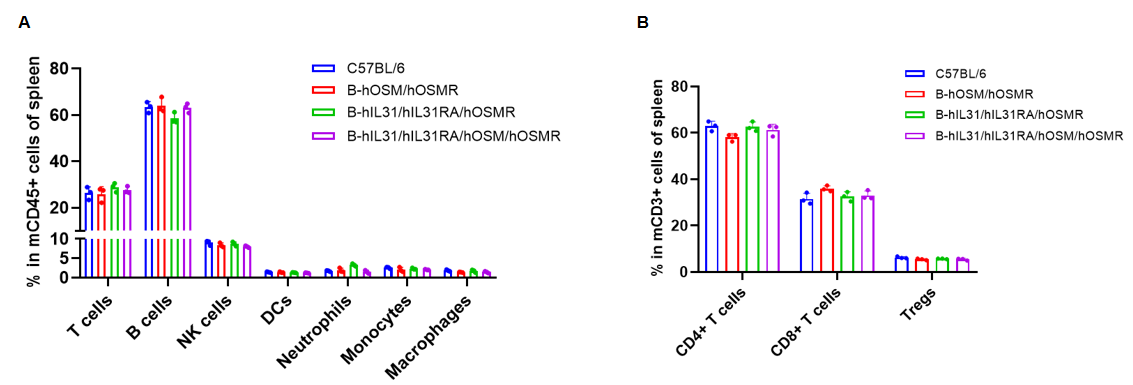
Analysis of spleen leukocyte subpopulations by flow cytometry. Splenocytes were isolated from C57BL/6, B-hOSM/hOSMR mice, B-hIL31/hIL31RA/hOSMR mice and B-hIL31/hIL31RA/hOSM/hOSMR mice (n=3, 6 or 7-week-old, female, homozygous). Flow cytometry analysis of the splenocytes was performed to assess leukocyte subpopulations. (A) Spleen leukocyte subpopulations. (B) T cells subpopulations. Percent of T cells (CD8+ T cells, CD4+ T cells, and Tregs), B cells, NK cells, dendritic cells, neutrophils, macrophages and monocytes in B-hOSM/hOSMR mice, B-hIL31/hIL31RA/hOSMR mice and B-hIL31/hIL31RA/hOSM/hOSMR mice were similar to those in the C57BL/6 mice. Data was shown as mean ± SD, and analyzed using Ordinary one-way ANOVA method. (*p<0.05)

Analysis of blood leukocyte subpopulations by flow cytometry. Blood cells were isolated from C57BL/6, B-hOSM/hOSMR mice, B-hIL31/hIL31RA/hOSMR mice and B-hIL31/hIL31RA/hOSM/hOSMR mice (n=3, 6 or 7-week-old, female, homozygous). Flow cytometry analysis of the blood was performed to assess leukocyte subpopulations. (A) Blood leukocyte subpopulations. (B) T cells subpopulations. Percent of T cells (CD8+ T cells, CD4+ T cells, and Tregs), B cells, NK cells, dendritic cells, neutrophils, macrophages and monocytes in B-hOSM/hOSMR mice, B-hIL31/hIL31RA/hOSMR mice and B-hIL31/hIL31RA/hOSM/hOSMR mice were similar to those in the C57BL/6 mice. Data was shown as mean ± SD, and analyzed using Ordinary one-way ANOVA method. (*p<0.05)

Analysis of lymph node leukocyte subpopulations by flow cytometry. Lymph node cells were isolated from C57BL/6, B-hOSM/hOSMR mice, B-hIL31/hIL31RA/hOSMR mice and B-hIL31/hIL31RA/hOSM/hOSMR mice (n=3, 6 or 7-week-old, female, homozygous). Flow cytometry analysis of the lymph node was performed to assess leukocyte subpopulations. (A) Lymph node leukocyte subpopulations. (B) T cells subpopulations. Percent of T cells (CD8+ T cells, CD4+ T cells, and Tregs), B cells and NK cells in B-hOSM/hOSMR mice, B-hIL31/hIL31RA/hOSMR mice and B-hIL31/hIL31RA/hOSM/hOSMR mice were similar to those in the C57BL/6 mice. Data was shown as mean ± SD, and analyzed using Ordinary one-way ANOVA method. (*p<0.05)


