B-hTSLP/hTSLPR mice(C)
| Strain Name | BALB/cCrSlcNifdc-Tslptm1(TSLP)BcgenCrlf2tm2(CRLF2)Bcgen/Bcgen | Common Name | B-hTSLP/hTSLPR mice(C) |
| Background | BALB/cCrSlcNifdc | Catalog number |
112923 |
|
Aliases |
TSLP: NA; CRLF2: CRL2Y, TSLPR |
||
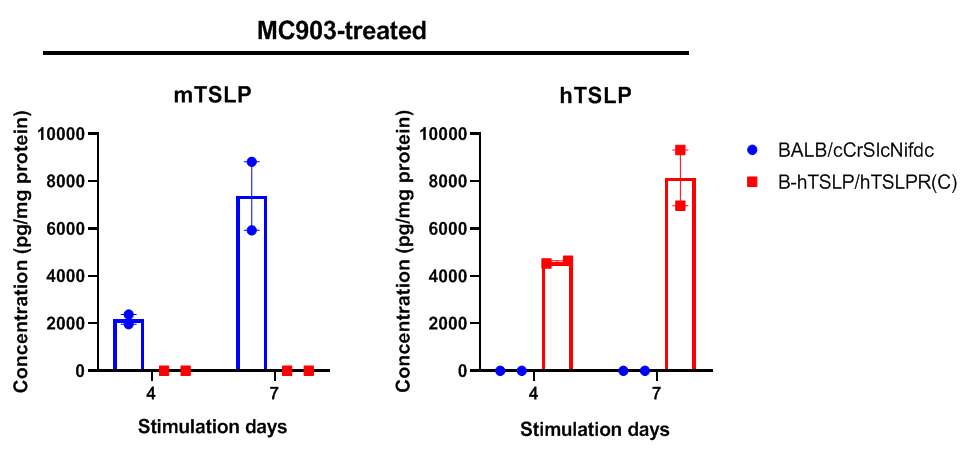
Strain specific TSLP expression analysis in wild-type BALB/cCrSlcNifdc mice and homozygous B-hTSLP/hTSLPR mice(C) by ELISA. Calcipotriol (MC903) was dissolved in ethanol and applied on ears of wild-type BALB/cCrSlcNifdc mice and homozygous B-hTSLP/hTSLPR mice(C) for 4 or 7 days. The ear grinding supernatant collected from the two strains of mouse were analyzed by ELISA (anti-mouse TSLP antibody: Biolegend, 434104; anti-human TSLP antibody: Biolegend, 434204). Mouse TSLP was only detectable in wild-type BALB/cCrSlcNifdc mice. Human TSLP was only detectable in homozygous B-hTSLP/hTSLPR mice(C) but not in wild-type mice. The expression level of TSLP continues to increase from day 4 to day 7 during stimulation.
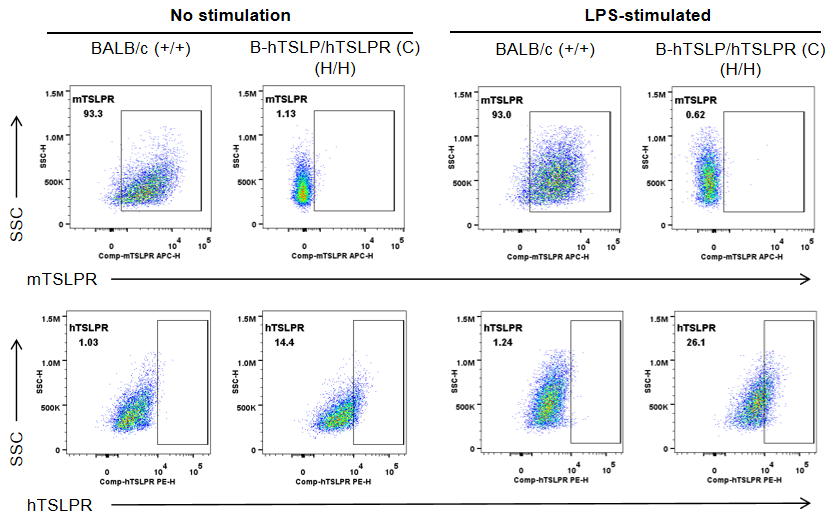
Strain specific TSLPR expression analysis in wild-type BALB/cCrSlcNifdc mice (+/+) and homozygous B-hTSLP/hTSLPR mice(C) (H/H) by flow cytometry. To generate DCs in vitro, bone marrow cells were isolated and induced with 200 ng/mL FLT3L (acrobiosystems, FLL-H5218) for 6 days. Purified DCs were respectively stimulated with 1 μg/mL LPS (sigma, L4391). Protein expression was analyzed with anti-mouse TSLPR antibody (Biolegend, 151805) and anti-human TSLPR antibody (Biolegend, 322805) by flow cytometry. Mouse TSLPR was exclusively detectable in wild-type BALB/cCrSlcNifdc mice. Human TSLPR was exclusively detectable in homozygous B-hTSLP/hTSLPR mice(C), but not in wild-type BALB/cCrSlcNifdc mice.
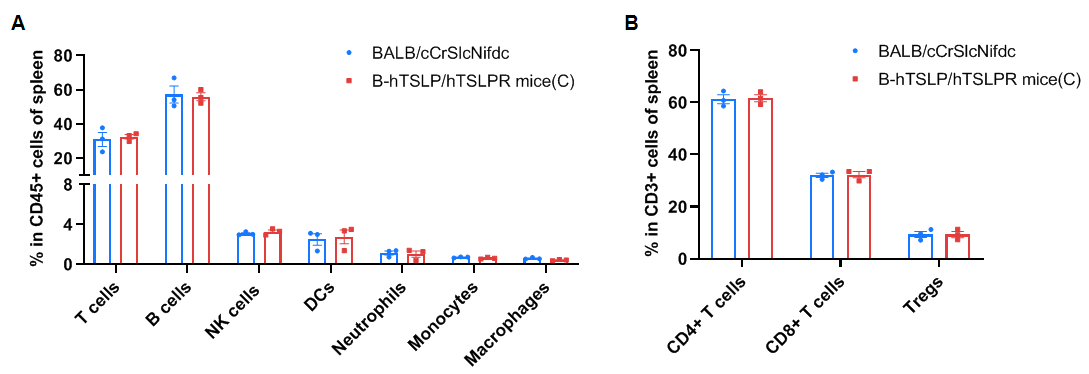
Frequency of leukocyte subpopulations in spleen by flow cytometry. Splenocytes were isolated from wild-type BALB/cCrSlcNifdc mice (male, n=3, 8-week-old) and homozygous B-hTSLP/hTSLPR mice(C) (male, n=3, 8-week-old). A. Flow cytometry analysis of the splenocytes was performed to assess the frequency of leukocyte subpopulations. B. Frequency of T cell subpopulations. Frequencies of T cells, B cells, NK cells, DCs, monocytes, macrophages, CD4+ T cells, CD8+ T cells and Tregs in B-hTSLP/hTSLPR mice(C) were similar to those in BALB/cCrSlcNifdc mice, demonstrating that humanization of TSLP and TSLPR does not change the frequency or distribution of these cell types in spleen. The frequency of leukocyte subpopulations in lymph nodes and blood of B-hTSLP/hTSLPR mice(C) were also comparable to wild-type BALB/cCrSlcNifdc mice (Data not shown). Values are expressed as mean ± SEM. Significance was determined by two-way ANOVA test. *P < 0.05, **P < 0.01, ***p < 0.001.
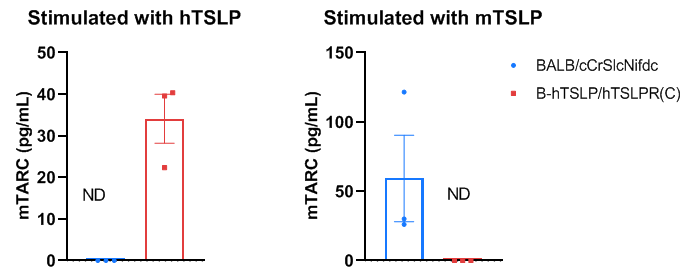
Mouse TARC was induced with mouse TSLP and human TSLP in wild-type BALB/cCrSlcNifdc mice and homozygous B-hTSLP/hTSLPR mice(C). To generate DCs in vitro, bone marrow cells were isolated from wild-type BALB/cCrSlcNifdc mice and B-hTSLP/hTSLPR mice(C) (male, 8-week-old, n=3), and induced with 200 ng/mL FLT3L (acrobiosystems, FLL-H5218) for 6 days. Purified DCs were respectively stimulated with 400 ng/mL mouse TSLP (novoprotein, CJ69) or 400 ng/mL human TSLP (acrobiosystems, TSP-H52Hb). Concentration of mouse TARC secreted from DCs was assayed with anti-mouse TARC antibody (R&D, MCC170) by ELISA. Mouse TARC was successfully induced with mouse TSLP in wild-type BALB/c mice, but not in homozygous B-hTSLP/hTSLPR mice(C). Meanwhile, mouse TARC was successfully induced with human TSLP in B-hTSLP/hTSLPR mice(C), but not in wild-type BALB/c mice. These results indicate that humanized TSLP receptor can only recognize human TSLP ligand to activate DCs from B-hTSLP/hTSLPR mice(C). Values are expressed as mean ± SEM. Significance was determined by two-way ANOVA test. *P < 0.05, **P < 0.01, ***P < 0.001.

Analysis of immune cells in BALF by flow cytometry. B-hTSLP/hTSLPR mice(C) (female, 10-week-old, n=6) were stimulated with inducer to induce asthma-like symptoms. Anti-human TSLP antibody (tezepelumab analog, synthesized in-house) was intraperitoneally injected. Broncheoalveolar fluid (BALF) was collected at the end of the experiment to detect inflammatory cell infiltration in lung tissue. The results showed that the number and frequency of eosinophils induced in the untreated modeling group (G2) was significantly higher than that in the un-modeling group (G1), while the number and frequencies of these cells in the treated group (G3-G5) decreased significantly when compared with the untreated modeling group (G2). Values are expressed as mean ± SEM. Significance was determined by one-way ANOVA test. *P < 0.05, **P < 0.01, ***P < 0.001.
The overage of this mouse model is 0%.
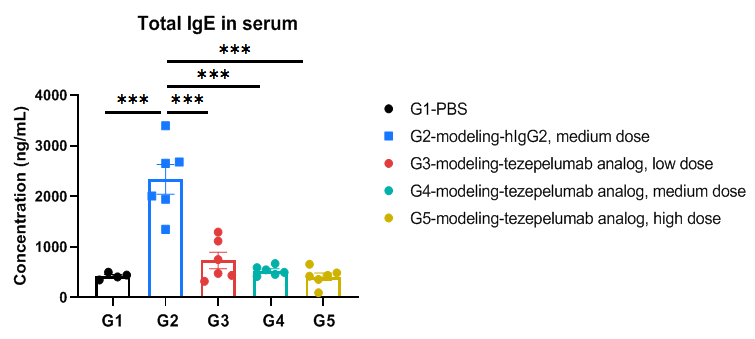
Total IgE in serum were significantly reduced in the mouse asthma model treated with anti-TSLP antibody. Serum was collected at the study endpoint. IgE levels were analyzed by ELISA. The results showed that the levels of total IgE in the groups (G3-G5) treated with tezepelumab analog (in-house) was significantly lower than that in untreated group (G2). Values are expressed as mean ± SEM. Significance was determined by one-way ANOVA test. *P < 0.05, **P < 0.01, ***P < 0.001.
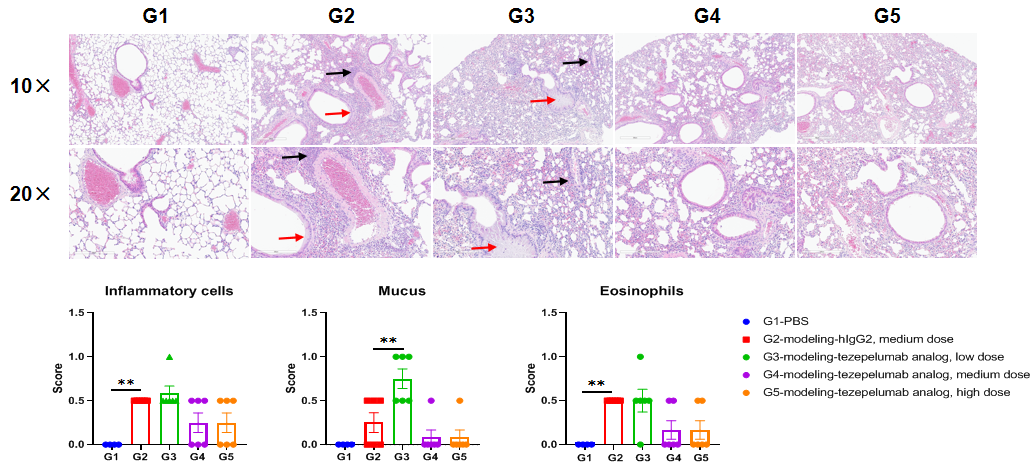
H&E staining of asthma-like model in B-hTSLP/hTSLPR mice(C) . Lung tissues were collected at the study endpoint and analyzed with H&E staining. The results showed that compared to the unmodeled group (G1), the modeled group (G2) showed a significant reduction in inflammatory infiltration and mucus secretion in lung tissue. The groups treated with higher doses of tezepelumab analog (in- house) showed a downward trend in inflammatory infiltration and mucus secretion in lung tissue. Black arrow: inflammatory cells; Red arrow: mucus. Values are expressed as mean ± SEM. Significance was determined by one-way ANOVA test. *P < 0.05, **P < 0.01, ***P < 0.001.


