| Strain Name |
C57BL/6-Tslptm1(TSLP)Bcgen Crlf2tm2(CRLF2)Bcgen/Bcgen
|
Common Name | B-hTSLP/hTSLPR mice |
| Background | C57BL/6 | Catalog number | 121269 |
|
Related Genes |
CRL2Y, TSLPR, CRLF2 | ||
|
NCBI Gene ID |
53603,57914 |
||
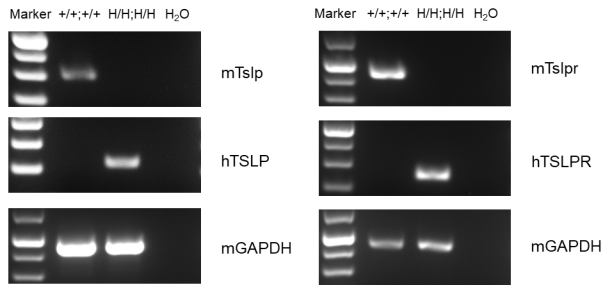
mRNA expression analysis

Strain specific TSLP expression analysis in homozygous B-hTSLP/hTSLPR mice by ELISA. Calcipotriol (MC903) was dissolved in ethanol and topically applied on ears of either wild type C57BL/6 mice (+/+;+/+) or homozygous B-hTSLP/hTSLPR mice (H/H;H/H) for 7 days. n=3. Ear grinding supernatant from the two mice was analyzed by ELISA. Mouse TSLP was detectable in wild type C57BL/6 mice. Human TSLP was exclusively detectable in homozygous B-hTSLP/hTSLPR mice but not in wild type mice.
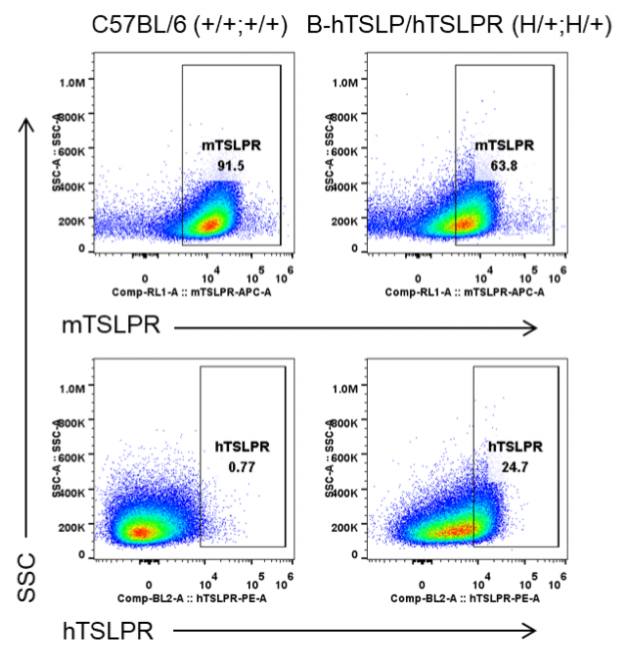
Strain specific TSLPR expression analysis in heterozygous B-hTSLP/hTSLPR mice by flow cytometry. Macrophages were collected from wild type C57BL/6 mice (+/+;+/+) and heterozygous B-hTSLP/hTSLPR mice (H/+;H/+), and analyzed by flow cytometry with species-specific anti-TSLPR antibody. Mouse TSLPR was detectable in wild type C57BL/6 mice and heterozygous B-hTSLP/hTSLPR mice. Human TSLPR was detectable in heterozygous B-hTSLP/hTSLPR mice but not in wild type mice.
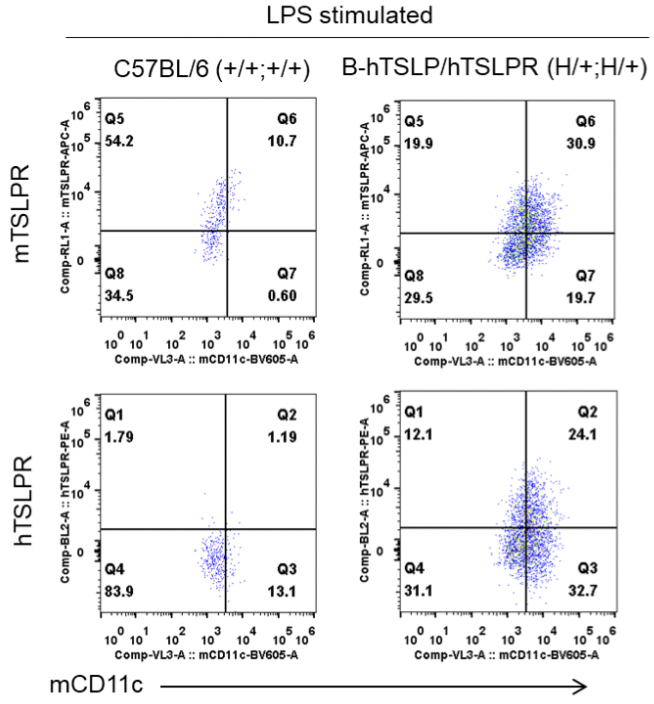
Strain specific TSLPR expression analysis in heterozygous B-hTSLP/hTSLPR mice by flow cytometry. Dendritic cells were induced from bone marrow of wild type C57BL/6 mice (+/+;+/+) and heterozygous B-hTSLP/hTSLPR mice (H/+;H/+), and stimulated with LPS. Protein expression was analyzed by flow cytometry with species-specific anti-TSLPR antibodies. Mouse TSLPR was detectable in wild type C57BL/6 mice and heterozygous B-hTSLP/hTSLPR mice. Human TSLPR was exclusively detectable in heterozygous B-hTSLP/hTSLPR mice but not in wild type mice.
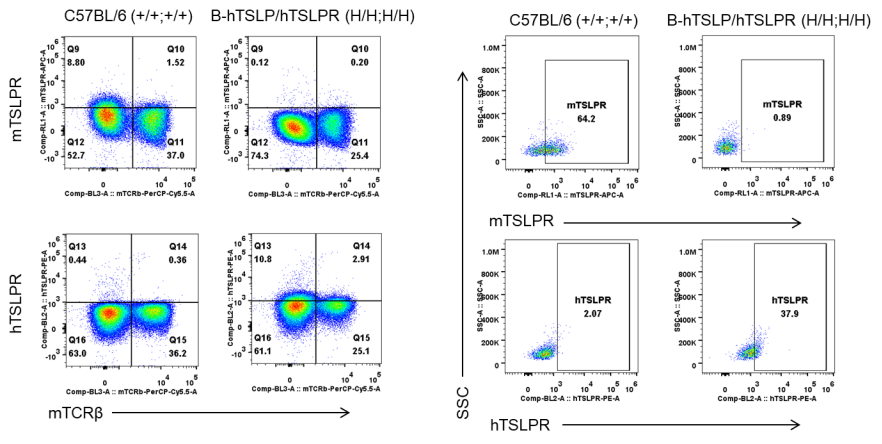
Protein expression analysis-TSLPR
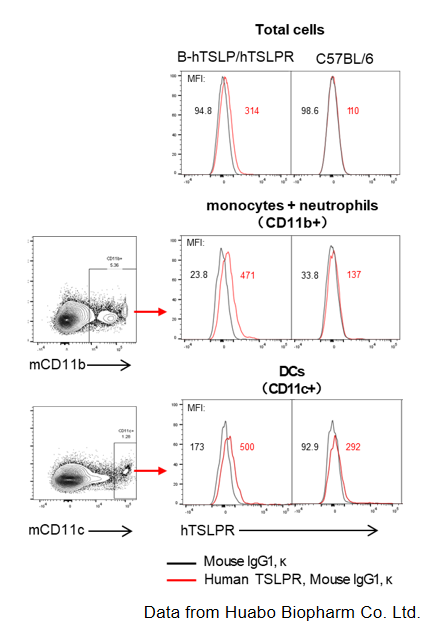
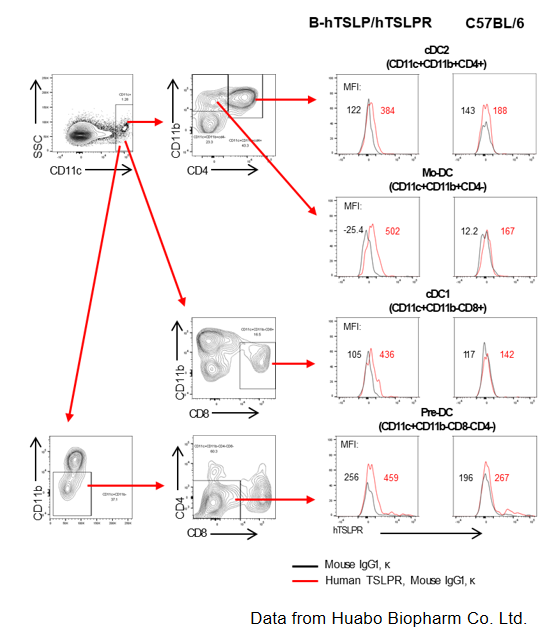
TSLPR protein expression analysis in T cells and ILC2 of blood
Functional analysis

Data from Huabo Biopharm Co. Ltd.
Mouse TARC was induced with human TSLP and mouse TSLP in homozygous B-hTSLP/hTSLPR mice analyzed by ELISA. Dendritic cells were respectively induced with FLT3L from bone marrow of homozygous B-hTSLP/hTSLPR mice (H/H) and wild-type C57BL/6 mice (+/+), and stimulated with human TSLP or mouse TSLP in vitro. Concentration of mouse TARC secreted from DCs was assayed by ELISA. Mouse TARC was successfully induced with human TSLP, but not mouse TSLP in homozygous B-hTSLP/hTSLPR mice. Meanwhile mouse TARC was successfully induced with mouse TSLP, but not human TSLP in wild-type C57BL/6 mice. Results indicated that TSLP and TSLPR are not cross-reactive between mouse and human. Introduction of human TSLP and TSLPR genes in place of its mouse counterpart does not change the stimulation effect of TSLP on dendritic cells.
Analysis of leukocytes cell subpopulation in spleen

Analysis of spleen leukocyte subpopulations by FACS. Splenocytes were isolated from female C57BL/6 and B-hTSLP/hTSLPR mice (n=3, 8-week-old). Flow cytometry analysis of the splenocytes was performed to assess leukocyte subpopulations. A. Representative FACS plots. Single live cells were gated for the CD45+ population and used for further analysis as indicated here. B. Results of FACS analysis. Percent of T cells, B cells, NK cells, dendritic cells, granulocytes, monocytes and macrophages in homozygous B-hTSLP/hTSLPR mice were similar to those in the C57BL/6 mice, demonstrating that hTSLP/hTSLPR humanized does not change the overall development, differentiation or distribution of these cell types in spleen. Values are expressed as mean ± SEM.
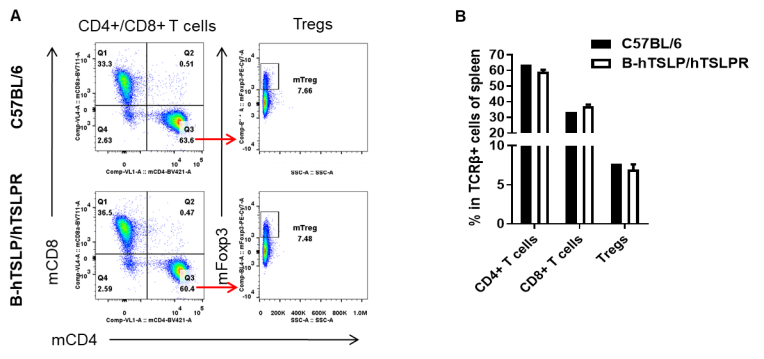
Analysis of spleen T cell subpopulations by FACS. Splenocytes were isolated from female C57BL/6 and B-hTSLP/hTSLPR mice (n=3, 8-week-old). Flow cytometry analysis of the splenocytes was performed to assess leukocyte subpopulations. A. Representative FACS plots. Single live CD45+ cells were gated for TCRβ+ T cell population and used for further analysis as indicated here. B. Results of FACS analysis. The percent of CD4+ T cells, CD8+ T cells and Tregs in homozygous B-hTSLP/hTSLPR mice were similar to those in the C57BL/6 mice, demonstrating that introduction of hTSLP/hTSLPR in place of its mouse counterpart does not change the overall development, differentiation or distribution of these T cell subtypes in spleen. Values are expressed as mean ± SEM.

Analysis of leukocyte subpopulations in bone marrow by FACS. Bone marrow was isolated from female C57BL/6 and B-hTSLP/hTSLPR mice (n=3, 8-week-old). Flow cytometry analysis of the cells was performed to assess leukocyte subpopulations. A. Representative FACS plots. Single live cells were gated for the CD45+ population and used for further analysis as indicated here. B. Results of FACS analysis. Percent of T cells, B cells, NK cells, dendritic cells, granulocytes, monocytes and macrophages in homozygous B-hTSLP/hTSLPR mice were similar to those in the C57BL/6 mice, demonstrating that hTSLP/hTSLPR humanized does not change the overall development, differentiation or distribution of these cell types in bone marrow. Values are expressed as mean ± SEM.

Analysis of leukocyte subpopulations in thymus by FACS. Thymus was isolated from female C57BL/6 and B-hTSLP/hTSLPR mice (n=3, 8-week-old). Flow cytometry analysis of the cells was performed to assess leukocyte subpopulations. A. Representative FACS plots. Single live cells were gated for the CD45+ population and used for further analysis as indicated here. B. Results of FACS analysis. Percent of T cells, B cells, NK cells, dendritic cells, granulocytes, monocytes and macrophages in homozygous B-hTSLP/hTSLPR mice were similar to those in the C57BL/6 mice, demonstrating that hTSLP/hTSLPR humanized does not change the overall development, differentiation or distribution of these cell types in thymus. Values are expressed as mean ± SEM.
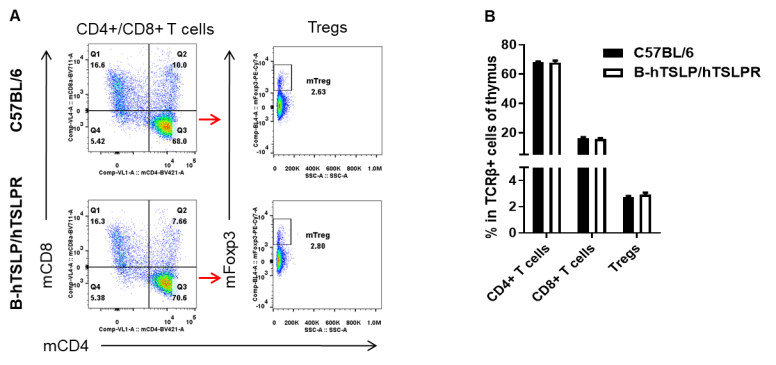
Analysis of T cell subpopulations in thymus by FACS. Leukocytes were isolated from female C57BL/6 and B-hTSLP/hTSLPR mice (n=3, 8-week-old). Flow cytometry analysis of the leukocytes was performed to assess leukocyte subpopulations. A. Representative FACS plots. Single live CD45+ cells were gated for TCRβ+ T cell population and used for further analysis as indicated here. B. Results of FACS analysis. The percent of CD4+ T cells, CD8+ T cells, and Tregs in homozygous B-hTSLP/hTSLPR mice were similar to those in the C57BL/6 mice, demonstrating that introduction of hTSLP/hTSLPR in place of its mouse counterpart does not change the overall development, differentiation or distribution of these T cell subtypes in thymus. Values are expressed as mean ± SEM.

Analysis of blood leukocyte subpopulations by FACS. Blood cells were isolated from female C57BL/6 and B-hTSLP/hTSLPR mice (n=3, 8-week-old). Flow cytometry analysis of the blood cells was performed to assess leukocyte subpopulations. A. Representative FACS plots. Single live cells were gated for the CD45+ population and used for further analysis as indicated here. B. Results of FACS analysis. Percent of T cells, B cells, NK cells, dendritic cells, granulocytes, monocytes and macrophages in homozygous B-hTSLP/hTSLPR mice were similar to those in the C57BL/6 mice, demonstrating that hTSLP/hTSLPR humanized does not change the overall development, differentiation or distribution of these cell types in blood. Values are expressed as mean ± SEM.
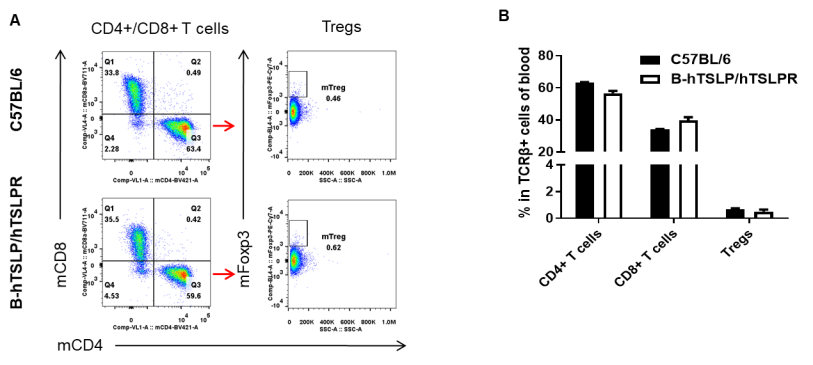
Analysis of blood T cell subpopulations by FACS. Blood cells were isolated from female C57BL/6 and B-hTSLP/hTSLPR mice (n=3, 8-week-old). Flow cytometry analysis of the blood cells was performed to assess leukocyte subpopulations. A. Representative FACS plots. Single live CD45+ cells were gated for TCRβ+ T cell population and used for further analysis as indicated here. B. Results of FACS analysis. The percent of CD4+ T cells, CD8+ T cells, and Tregs in homozygous B-hTSLP/hTSLPR mice were similar to those in the C57BL/6 mice, demonstrating that introduction of hTSLP/hTSLPR in place of its mouse counterpart does not change the overall development, differentiation or distribution of these T cell subtypes in blood. Values are expressed as mean ± SEM.
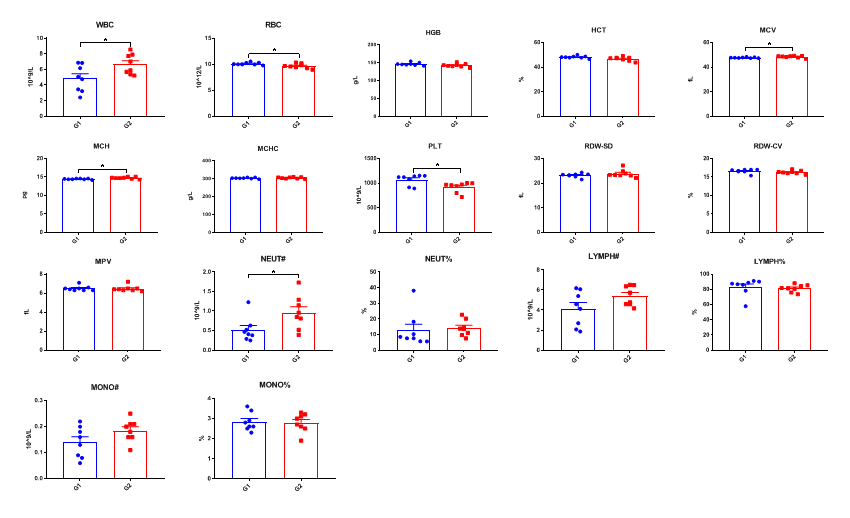
Complete blood count (CBC). Blood from female C57BL/6 and B-hTSLP/hTSLPR mice (n=8, 10-11-week-old) was collected and analyzed for CBC. The measurements of B-hTSLP/hTSLPR mice were similar to that in C57BL/6 mice, indicating that introduction of hTSLP/hTSLPR in place of its mouse counterpart does not change blood cell composition and morphology. Values are expressed as mean ± SEM.
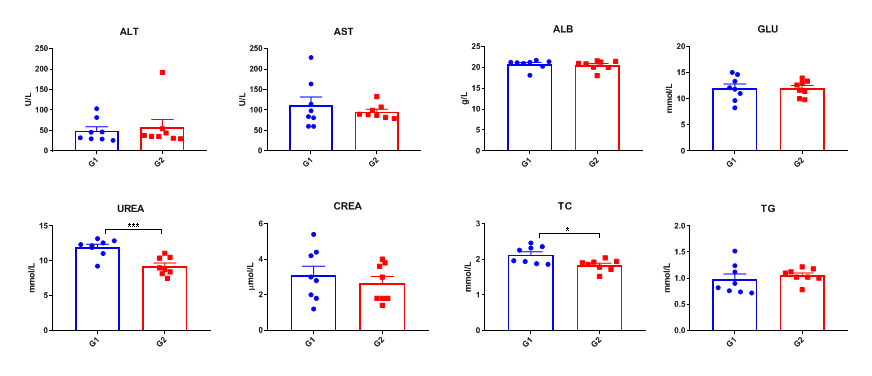
Blood chemistry tests of B-hTSLP/hTSLPR mice. Serum from the C57BL/6 and B-hTSLP/hTSLPR mice (n=8, 10-11-week-old) was collected and analyzed for levels of indicators. The measurements of B-hTSLP/hTSLPR mice were similar to that in C57BL/6 mice, indicating that introduction of hTSLP/hTSLPR in place of its mouse counterpart does not change the health of related organs. Values are expressed as mean ± SEM.
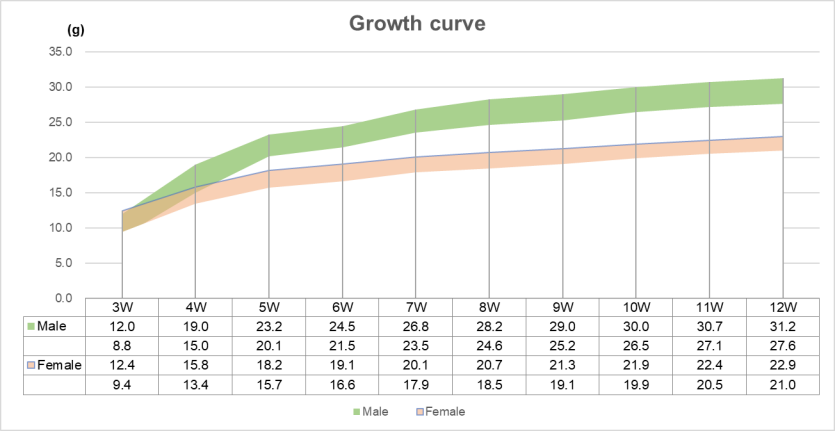
Growth curve

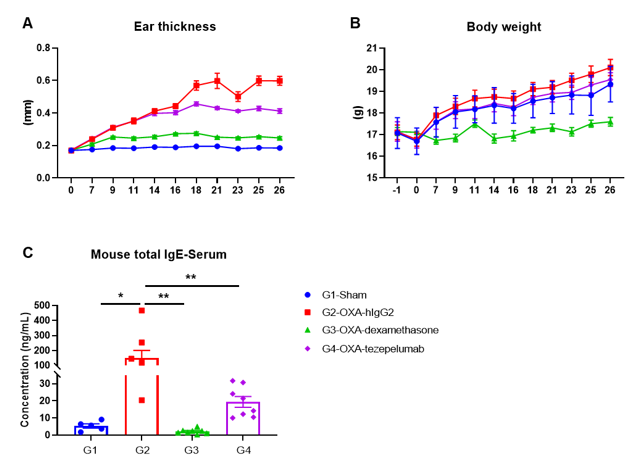
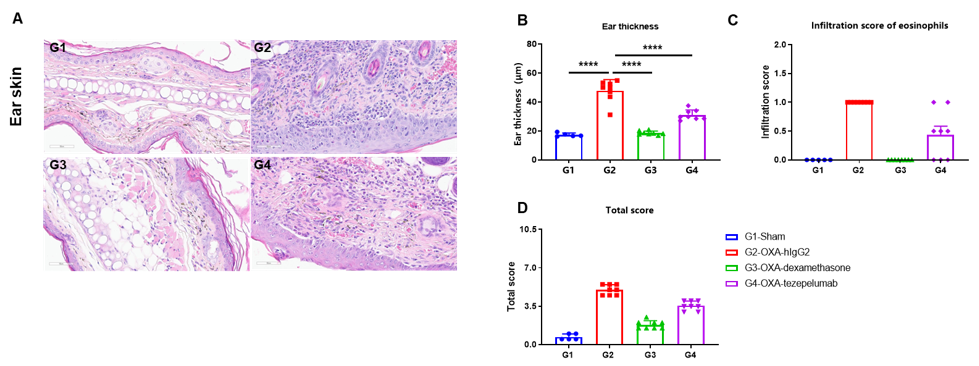
Experimental schedule for Induction of atopic dermatitis (AD)-like skin lesions and in vivo efficacy of anti-human TSLP antibody. OXA was applied to ear skin of mice on day 0, and then challenge to the same site of skin nine times from days 7 to 25. Anti-human TSLP antibody tezepelumab (in house) was administered by intraperitoneal injection (n = 8). OXA: oxazolone.
In vivo efficacy of anti-human TSLP antibody in OXA induced AD-like mouse model
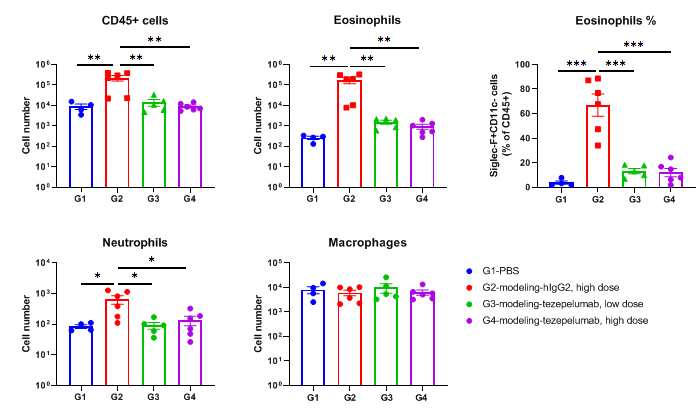
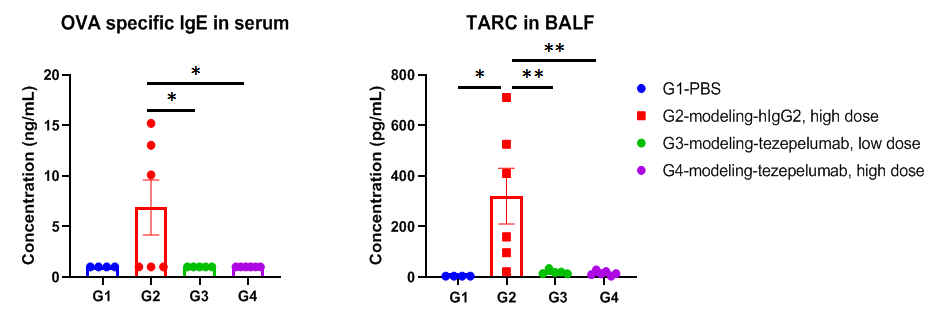
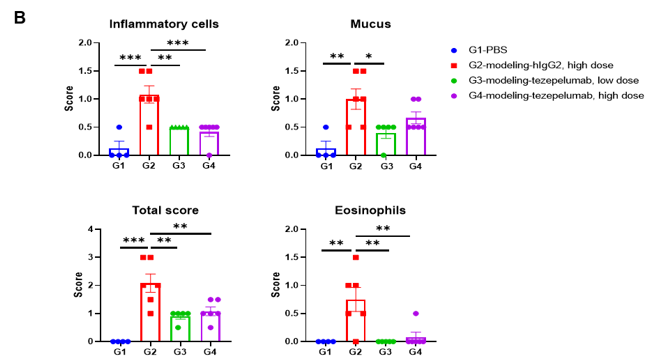
In vivo efficacy of anti-human TSLP antibody in mouse asthma model
