|
Strain Name
|
C57BL/6N-Apoc3tm1(APOC3)Bcgen/Bcgen
|
Common Name
|
B-hAPOC3 mice
|
|
Background
|
C57BL/6N
|
Catalog number
|
112411
|
|
Aliases
|
APOC3: Apo-C3, ApoC-3, APOCIII
|
Protein expression analysis

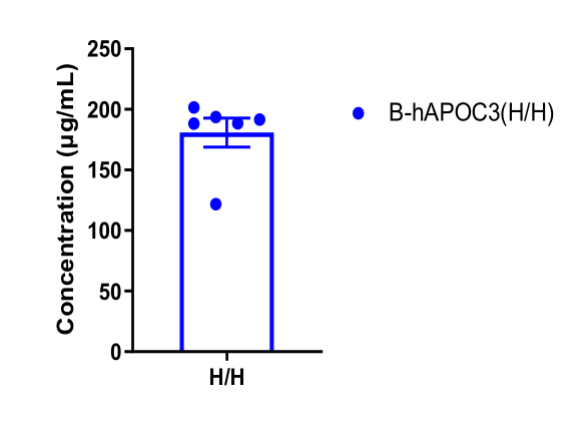
Strain specific APOC3 expression analysis in homozygous B-hAPOC3 mice by ELISA. Serum were isolated from homozygous B-hAPOC3 mice (H/H) and analyzed by ELISA with species-specific APOC3 ELISA kit. Human APOC3 was exclusively detectable in homozygous B-hAPOC3 mice.
mRNA expression analysis

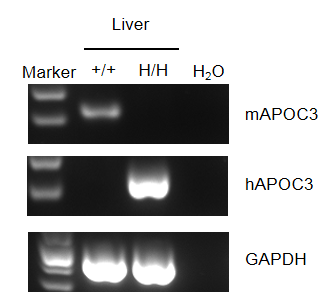
Strain specific analysis of APOC3 mRNA expression in wild-type C57BL/6 mice and B-hAPOC3 mice by RT-PCR. Liver RNA were isolated from wild type C57BL/6 mice (+/+) and homozygous B-hAPOC3 mice (H/H), then cDNA libraries were synthesized by reverse transcription, followed by PCR with mouse or human APOC3 primers. Mouse Apoc3 mRNA was detectable only in wild-type C57BL/6 mice. Human APOC3 mRNA was detectable only in homozygous B-hAPOC3 mice but not in wild-type mice.
Analysis of lipid metabolism after APOC3 humanization in B-hAPOC3 mice

Lipid metabolism analysis in B-hAPOC3 mice. Plasma concentrations of TG, TC, LDL-C, and HDL-C in B-hAPOC3 mice and wild-type C57BL/6 mice (5 weeks old) were analyzed. The TG of B-hAPOC3 mice is significantly higher than that of wild-type C57BL/6 mice.
TG, triglycerides; TC, total cholesterol; HDL-C, high-density lipoprotein cholesterol; LDL-C, low-density lipoprotein cholesterol.
Inhibitory efficiency of the nucleic acid drugs against the human APOC3

The inhibitory efficiency of the nucleic acid drugs against human APOC3 in B-hAPOC3 mice. B-hAPOC3 mice were randomly divided into two groups (n=3/group, 6 weeks old). The human APOC3 targeted nucleic acid drugs (synthesized according to patents) and PBS were administered to the mice individually. The nucleic acid drugs was administered in the form of PBS aqueous solution. The drug dosages for all animals were calculated according to the body weight. The mice were sacrificed on day 14, and the liver tissue was collected to detect the expression level of human APOC3 mRNA by qPCR. (A) The schematic diagram of experimental processing. (B) The blood lipids level of B-hAPOC3 mice after treatment. Compared with the control group (G1), the treatment group (G2) showed a significant decrease in TG. (C) The expression of human APOC3 mRNA in liver. The human APOC3 in the treatment group (G2) was significantly reduced compared to the control group (G1) and the inhibition rate in the treatment group was 73.4%, demonstrating that B-hAPOC3 mice provide a powerful preclinical model for in vivo evaluation of human APOC3 targeted nucleic acid drugs. Values are expressed as mean ± SEM.


