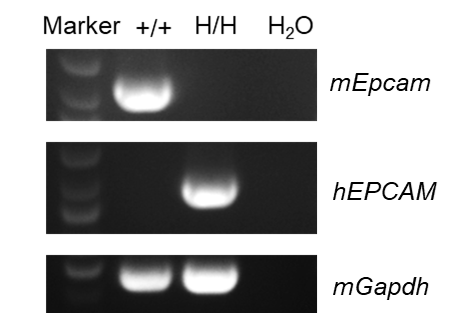
mRNA expression analysis
Strain specific analysis of EPCAM mRNA expression in wild-type C57BL/6 mice and B-hCD3EDG/hEPCAM mice by RT-PCR. Small intestine RNA were isolated from wild-type C57BL/6 mice (female, 6-week-old, n=1) and homozygous B-hCD3EDG/hEPCAM mice (female, 6-week-old, n=1), then cDNA libraries were synthesized by reverse transcription, followed by PCR with mouse or human EPCAM primers. Mouse Epcam mRNA was only detectable in wild-type mice (+/+). Human EPCAM mRNA was exclusively detectable in homozygous B-hCD3EDG/hEPCAM mice (H/H) but not in wild-type mice (+/+).
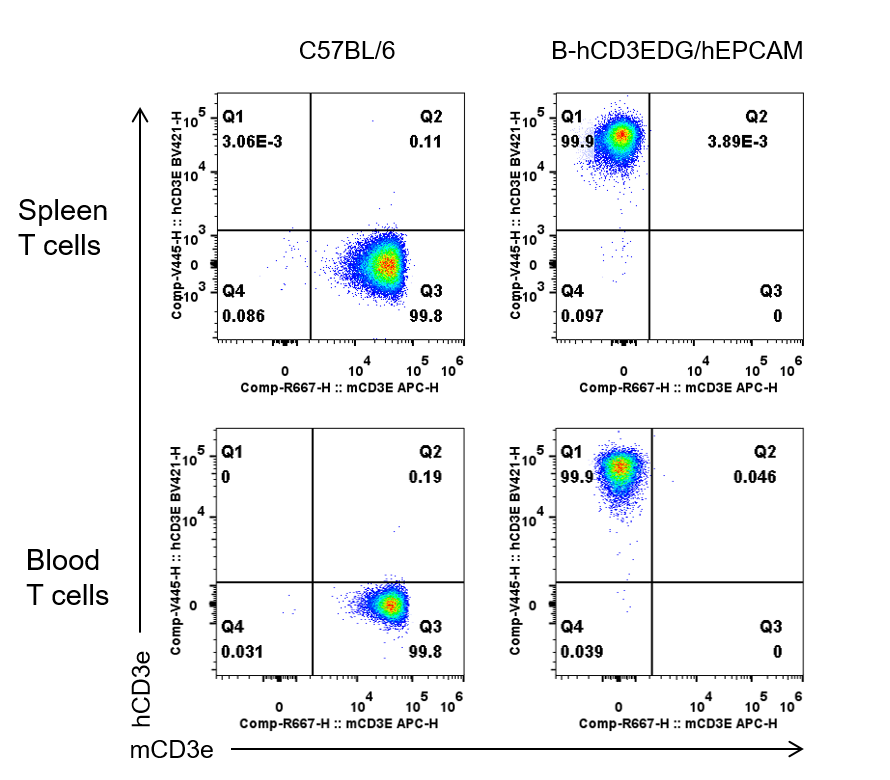
Protein expression analysis
CD3E expression analysis in wild-type C57BL/6 mice and homozygous B-hCD3EDG/hEPCAM mice by flow cytometry. Spleen and blood T cells were collected from wild-type C57BL/6 mice (female, 6-week-old, n=1) and homozygous B-hCD3EDG/hEPCAM mice (female, 6-week-old, n=1). Protein expression was analyzed with anti-human CD3E antibody (BD Horizon™, 562426) and anti-mouse CD3E antibody (Biolegend, 100312) by flow cytometry. Human CD3E was exclusively detectable in homozygous B-hCD3EDG/hEPCAM mice, but not in wild-type C57BL/6 mice.
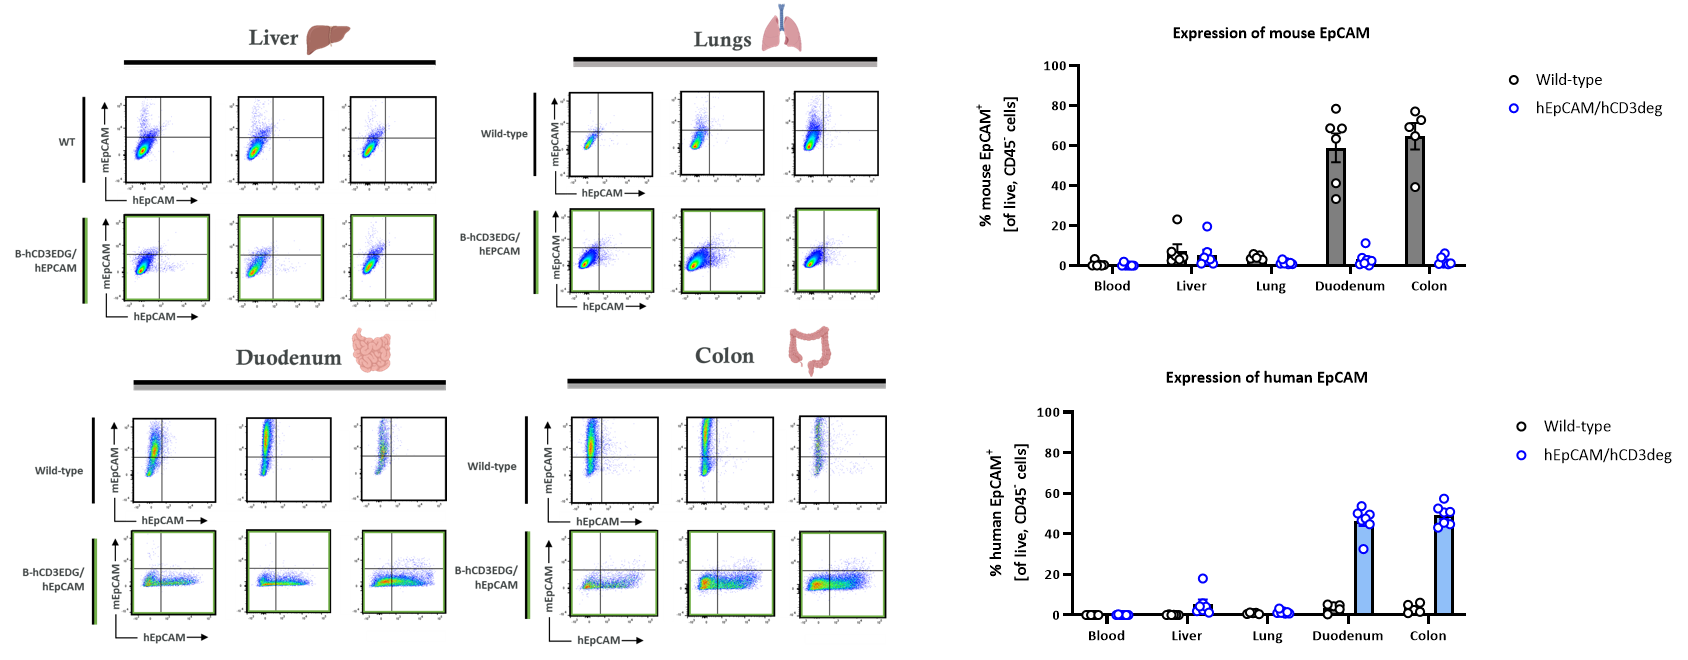
Protein Expression Profile of EPCAM
Tissue-specific expression of human and mouse EPCAM was assessed by flow cytometry in wild-type C57BL/6 mice and homozygous B-hCD3EDG/hEPCAM mice. Analysis revealed that human EpCAM is predominantly localized to the colon and duodenum, mirroring the endogenous expression pattern of mouse EpCAM. Expression levels were significantly higher in the gastrointestinal tract compared to the lung or liver. These findings demonstrate that human EpCAM expression in the B-hCD3EDG/hEPCAM model is tissue-restricted rather than systemic (The data was provided by client). Illustrations were created with BioRender.com
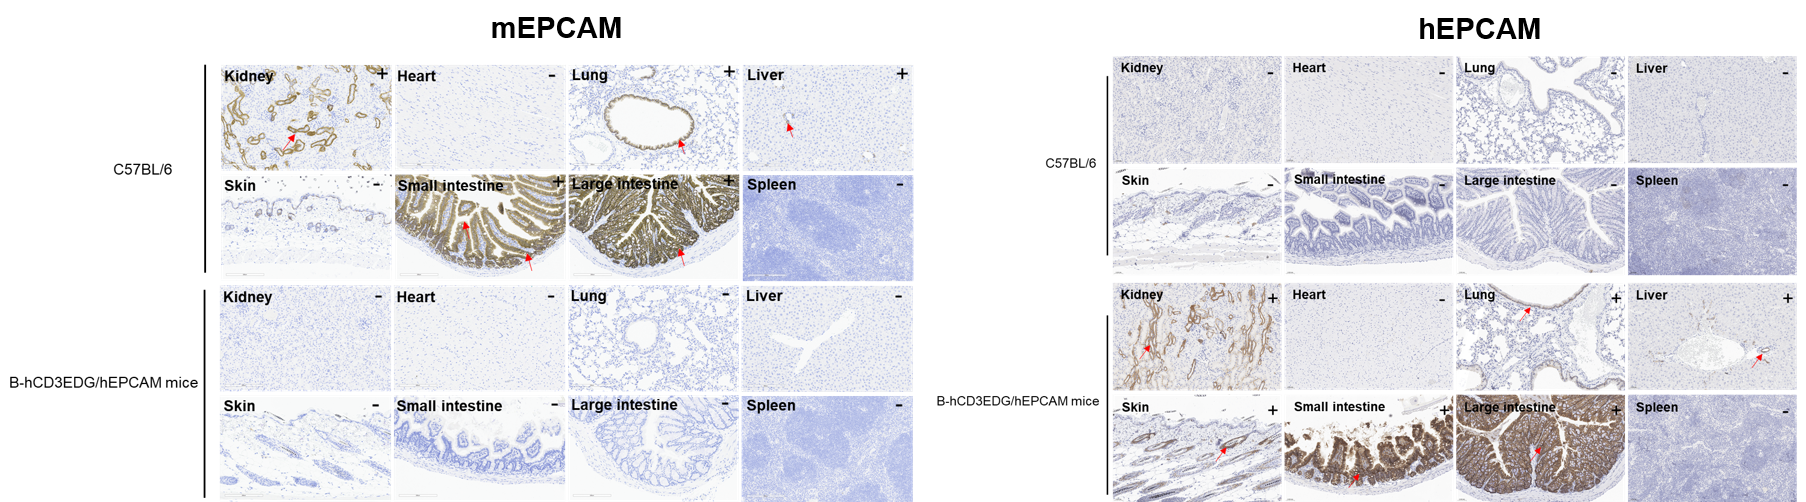
Immunohistochemical (IHC) analysis of EPCAM expression in B-hCD3EDG/hEPCAM mice. The kidney, heart, lung, liver, skin, small intestine, large intestine and spleen were collected from wild-type C57BL/6 mice and B-hCD3EDG/hEPCAM mice (female, 6-week-old), analyzed by IHC with anti-EPCAM antibody (anti-mEPCAM: abcam, ab213501; anti-hEPCAM: Novus Biologicals, NBP3-20379). Mouse EPCAM was detectable in C57BL/6 mice. Human EPCAM was detectable in B-hCD3EDG/hEPCAM mice. As shown, human EPCAM was detected in kidney, lung, liver, skin, small intestine and large intestine. The arrow indicates tissue cells with positive EPCAM staining (brown). “+” indicates that the tissue is positive, and “-” indicates that the tissue is negative.
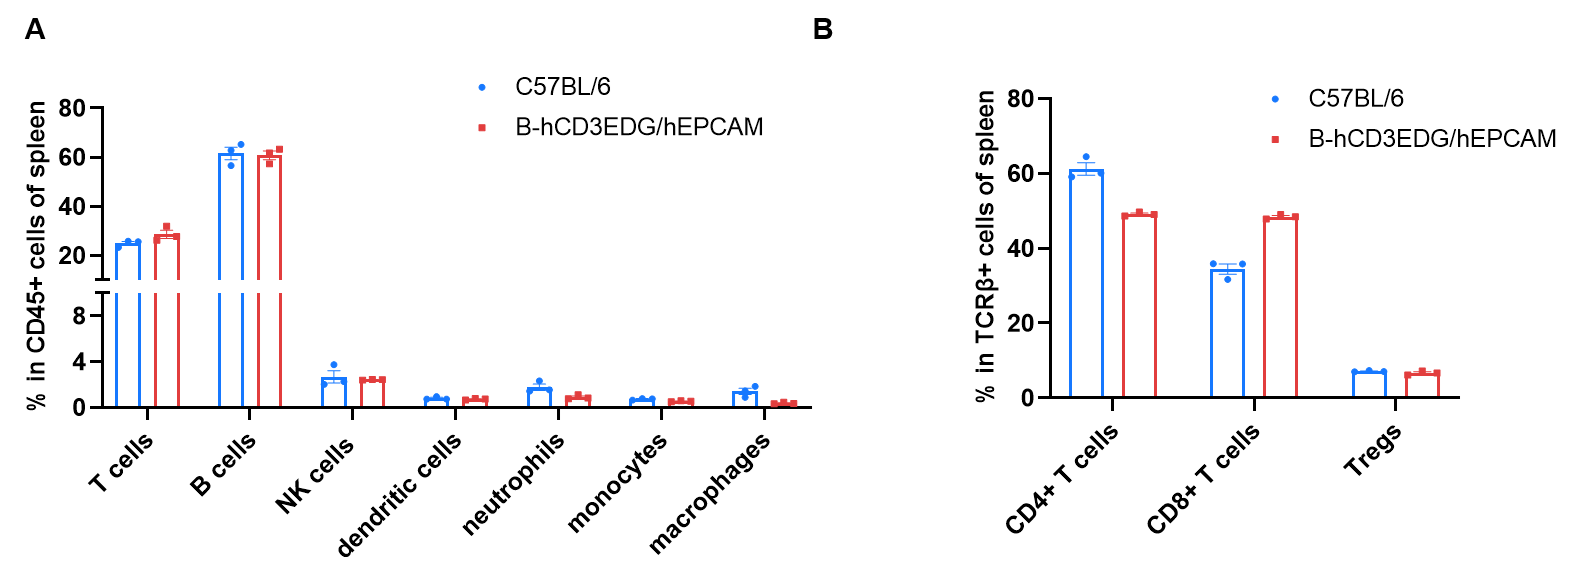
Frequency of leukocyte subpopulations in spleen
Frequency of leukocyte subpopulations in spleen by flow cytometry. Splenocytes were isolated from wild-type C57BL/6 mice (female, n=3, 6-week-old) and homozygous B-hCD3EDG/hEPCAM mice (female, n=3, 8-week-old). A. Flow cytometry analysis of the splenocytes was performed to assess the frequency of leukocyte subpopulations. B. Frequency of T cell subpopulations. Percentages of T cells, B cells, NK cells, dendritic cells, neutrophils, monocytes, macrophages, CD4+ T cells, CD8+ T cells and Tregs in B-hCD3EDG/hEPCAM mice were similar to those in C57BL/6 mice, demonstrating that humanization does not change the frequency or distribution of these cell types in spleen. The frequency of leukocyte subpopulations in blood and lymph node of B-hCD3EDG/hEPCAM mice were also comparable to wild-type C57BL/6 mice (Data not shown).
In vitro TDCC of Splenic T cells against NCI-H358-Luciferase Cells
Tumor-dependent cell cytotoxicity (TDCC) of splenic T cells was evaluated against NCI-H358-Luciferase cells. The TDCC assay was conducted using T cells isolated from mouse spleens as effector cells and NCI-H358-Luciferase tumor cells as targets. NCI-H358 cells express high levels of human EpCAM and EGFR. Effector and target cells were co-cultured at an effector-to-target (E:T) ratio of 10:1 for 6 days. Cytotoxicity was quantified by measuring luciferase activity in the target cells. The results confirm that CD3+ T cells from the spleens of B-hCD3EDG/hEPCAM mice respond to human-specific T-cell engagers, leading to efficient killing of human EpCAM-expressing cancer cells. This response was not observed in CD3+ T cells from the spleens of wild-type C57BL/6 mice. Thus, mouse T cells expressing human CD3E, 3D, 3G genes are functional and retain cytolytic activity. (Data provided by the client.)

Tumor-dependent cell cytotoxicity (TDCC) of splenic T cells was evaluated against NCI-H358-Luciferase cells. The TDCC assay was conducted using T cells isolated from mouse spleens as effector cells and NCI-H358-Luciferase tumor cells as targets. NCI-H358 cells express high levels of human EpCAM and EGFR. Effector and target cells were co-cultured at an effector-to-target (E:T) ratio of 5:1 for 6 days. Cytotoxicity was quantified by measuring luciferase activity in the target cells. The results confirm that CD3+ T cells from the spleens of B-hCD3EDG/hEPCAM mice respond to human-specific T-cell engagers, leading to efficient killing of human EpCAM-expressing cancer cells. This response was not observed in CD3+ T cells from the spleens of wild-type C57BL/6 mice. Thus, mouse T cells expressing human CD3E, 3D, 3G genes are functional and retain cytolytic activity. (Data provided by the client.)
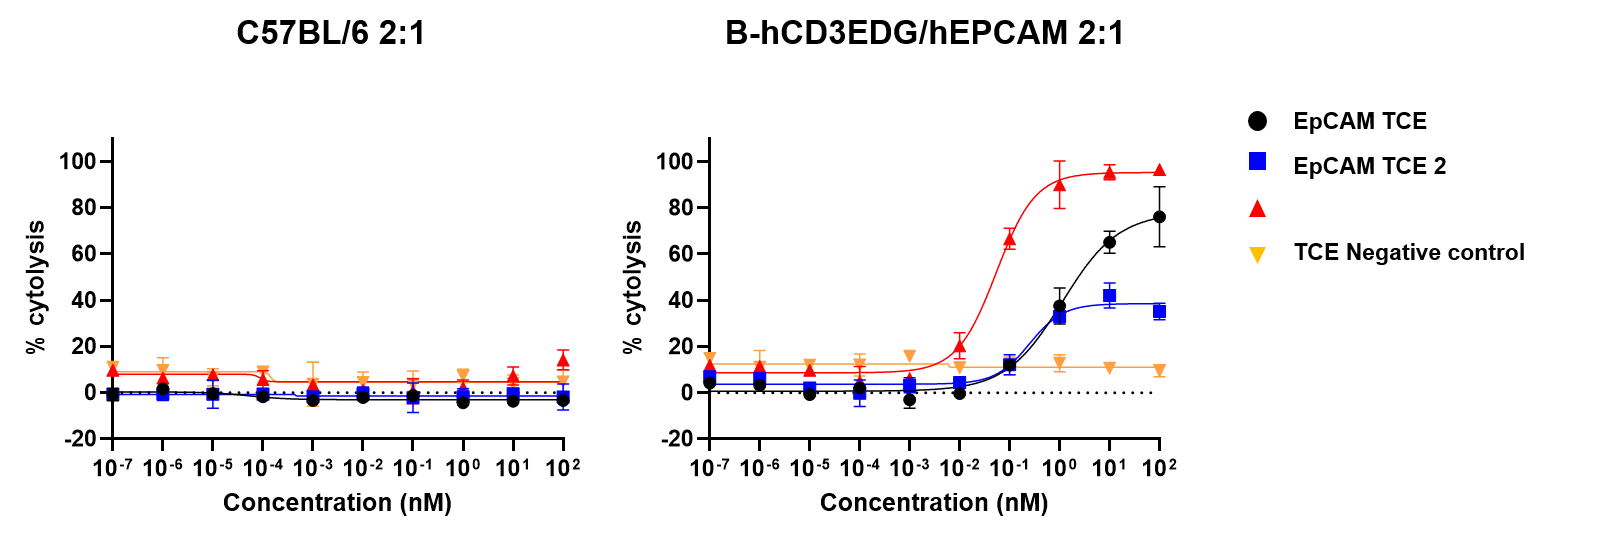
Tumor-dependent cell cytotoxicity (TDCC) of splenic T cells was evaluated against NCI-H358-Luciferase cells. The TDCC assay was conducted using T cells isolated from mouse spleens as effector cells and NCI-H358-Luciferase tumor cells as targets. NCI-H358 cells express high levels of human EpCAM and EGFR. Effector and target cells were co-cultured at an effector-to-target (E:T) ratio of 2:1 for 6 days. Cytotoxicity was quantified by measuring luciferase activity in the target cells. The results confirm that CD3+ T cells from the spleens of B-hCD3EDG/hEPCAM mice respond to human-specific T-cell engagers, leading to efficient killing of human EpCAM-expressing cancer cells. This response was not observed in CD3+ T cells from the spleens of wild-type C57BL/6 mice. Thus, mouse T cells expressing human CD3E, 3D, 3G genes are functional and retain cytolytic activity. (Data provided by the client.)
In Vivo Efficacy Evaluation of Solitomab in B-hCD3EDG/hEPCAM mice
Antitumor Activity of Anti-Human CD3/EPCAM Bispecific Antibodies (Solitomab, Commercialized) in B-hCD3EDG/hEPCAM Mice. B-hEPCAM MC38 mouse colon carcinoma cells were subcutaneously implanted into homozygous B-hCD3EDG/hEPCAM mice (male, 9-week-old, n=6). Mice were grouped once tumor volume reached approximately 100 mm³, at which time they were intravenously injected with anti-human CD3/EPCAM bispecific antibodies (indicated in the panel). (A) Anti-human CD3/EPCAM bispecific antibodies inhibited B-hEPCAM MC38 tumor growth in B-hCD3EDG/hEPCAM mice. (B) Body weight changes during treatment. Values are expressed as mean ± SEM.
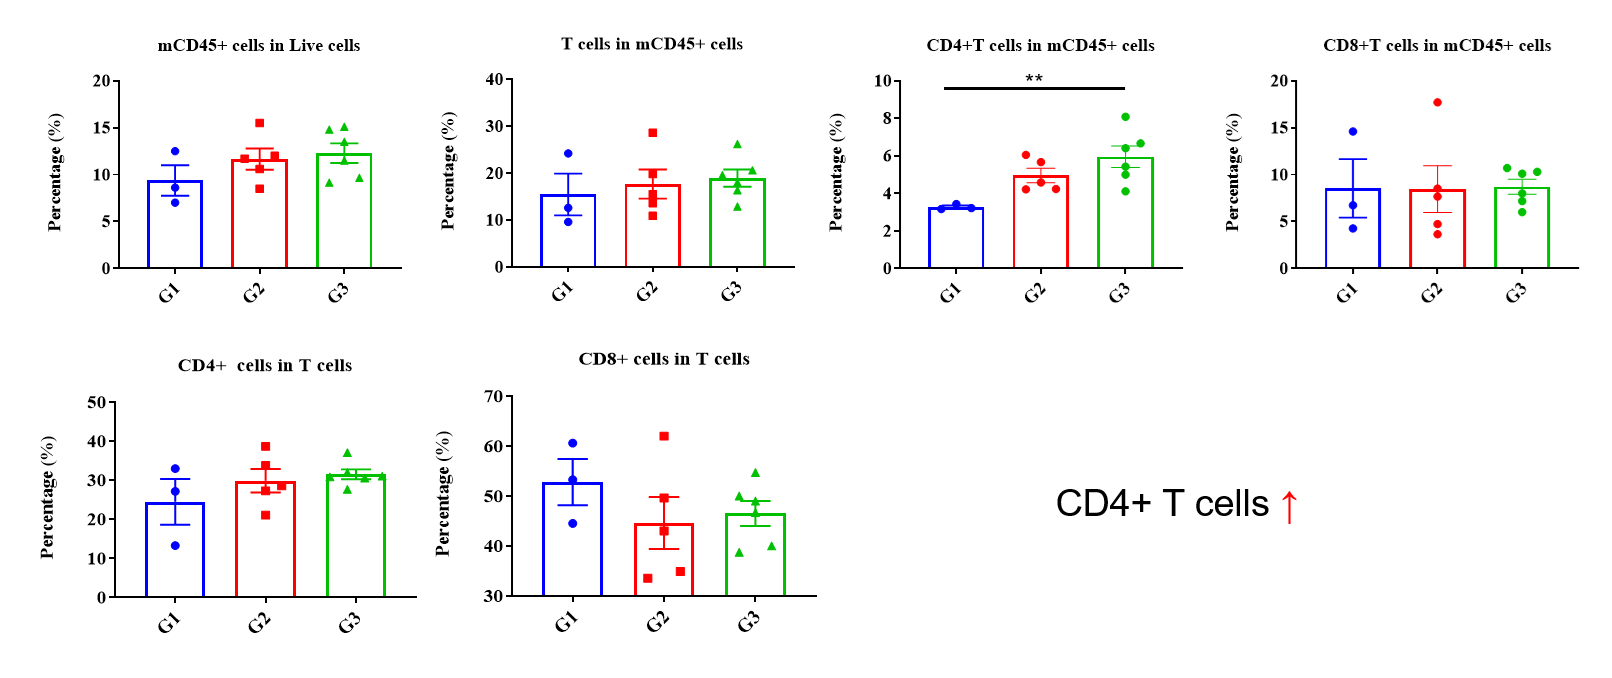
CD45+ Cells and T cell Subgroups in Tumor
Values are expressed as mean ± SEM. P value was analyzed by Ordinary one-way ANOVA analysis. P*<0.05;P**<0.01,P***<0.001
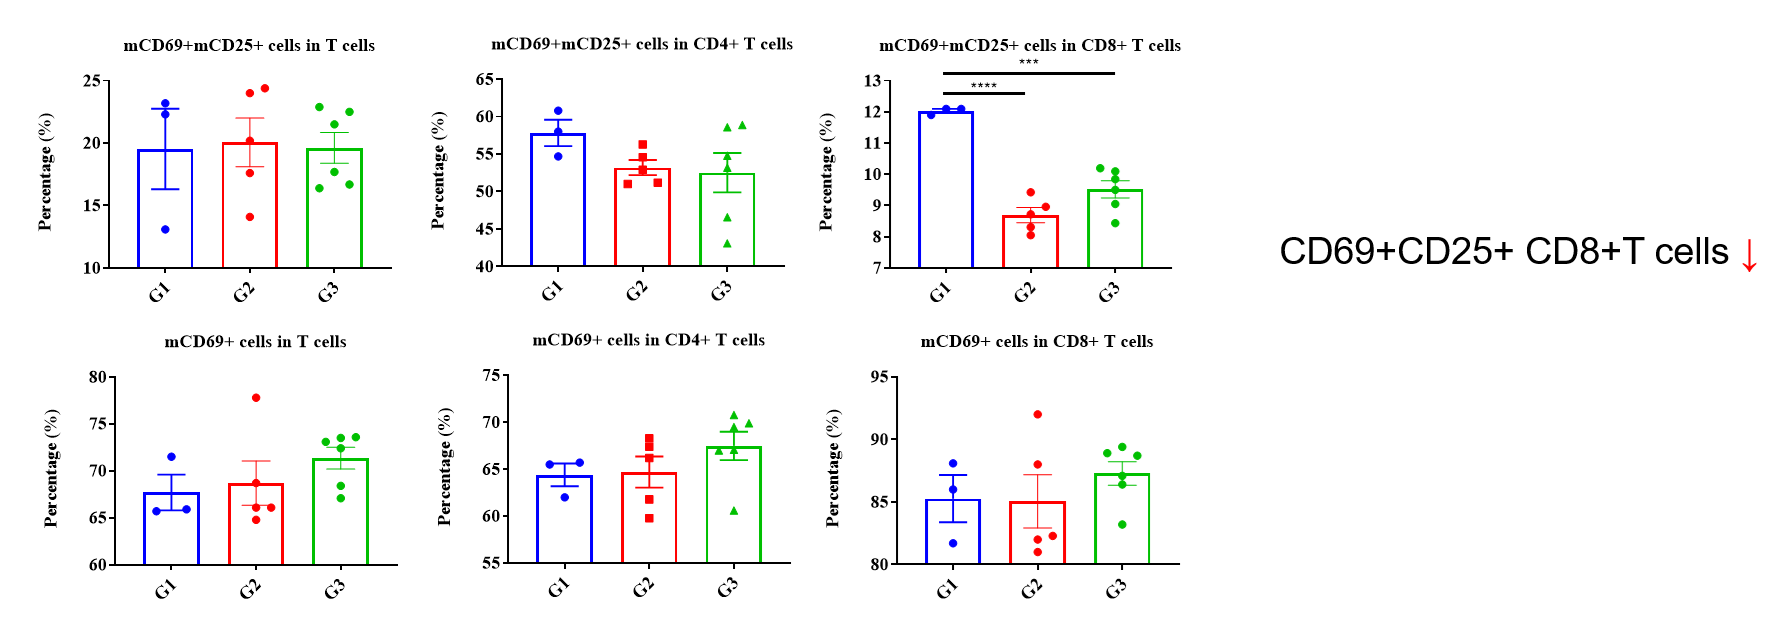
mCD69+mCD25+ or mCD69+ Cells in T cell Subgroups of Tumor
Values are expressed as mean ± SEM. P value was analyzed by Ordinary one-way ANOVA analysis. P*<0.05;P**<0.01,P***<0.001
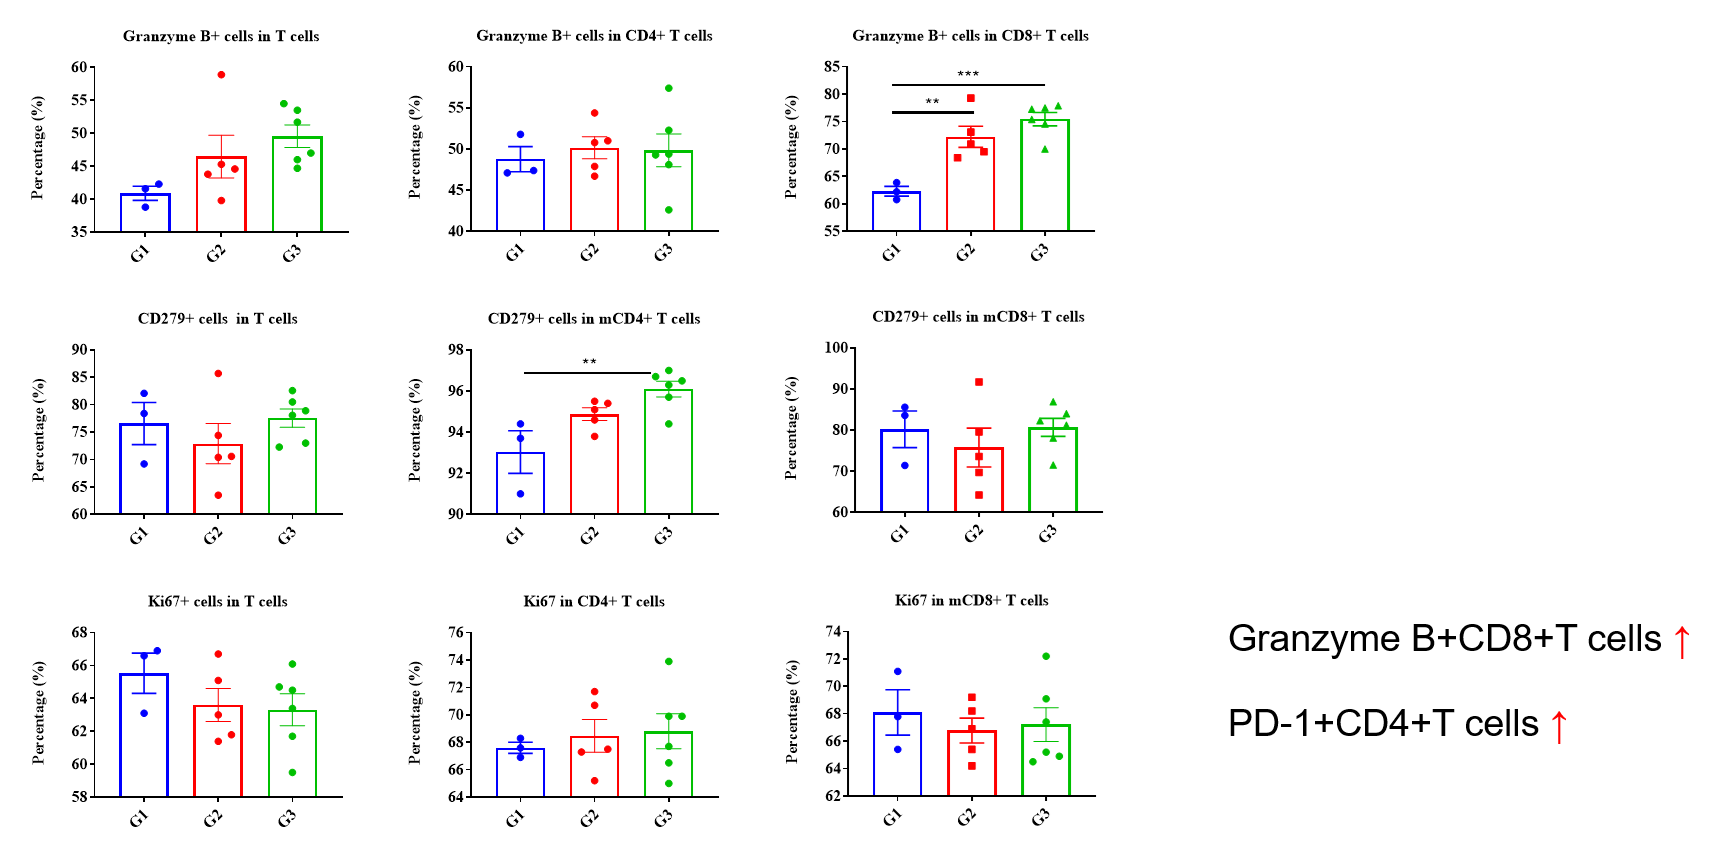
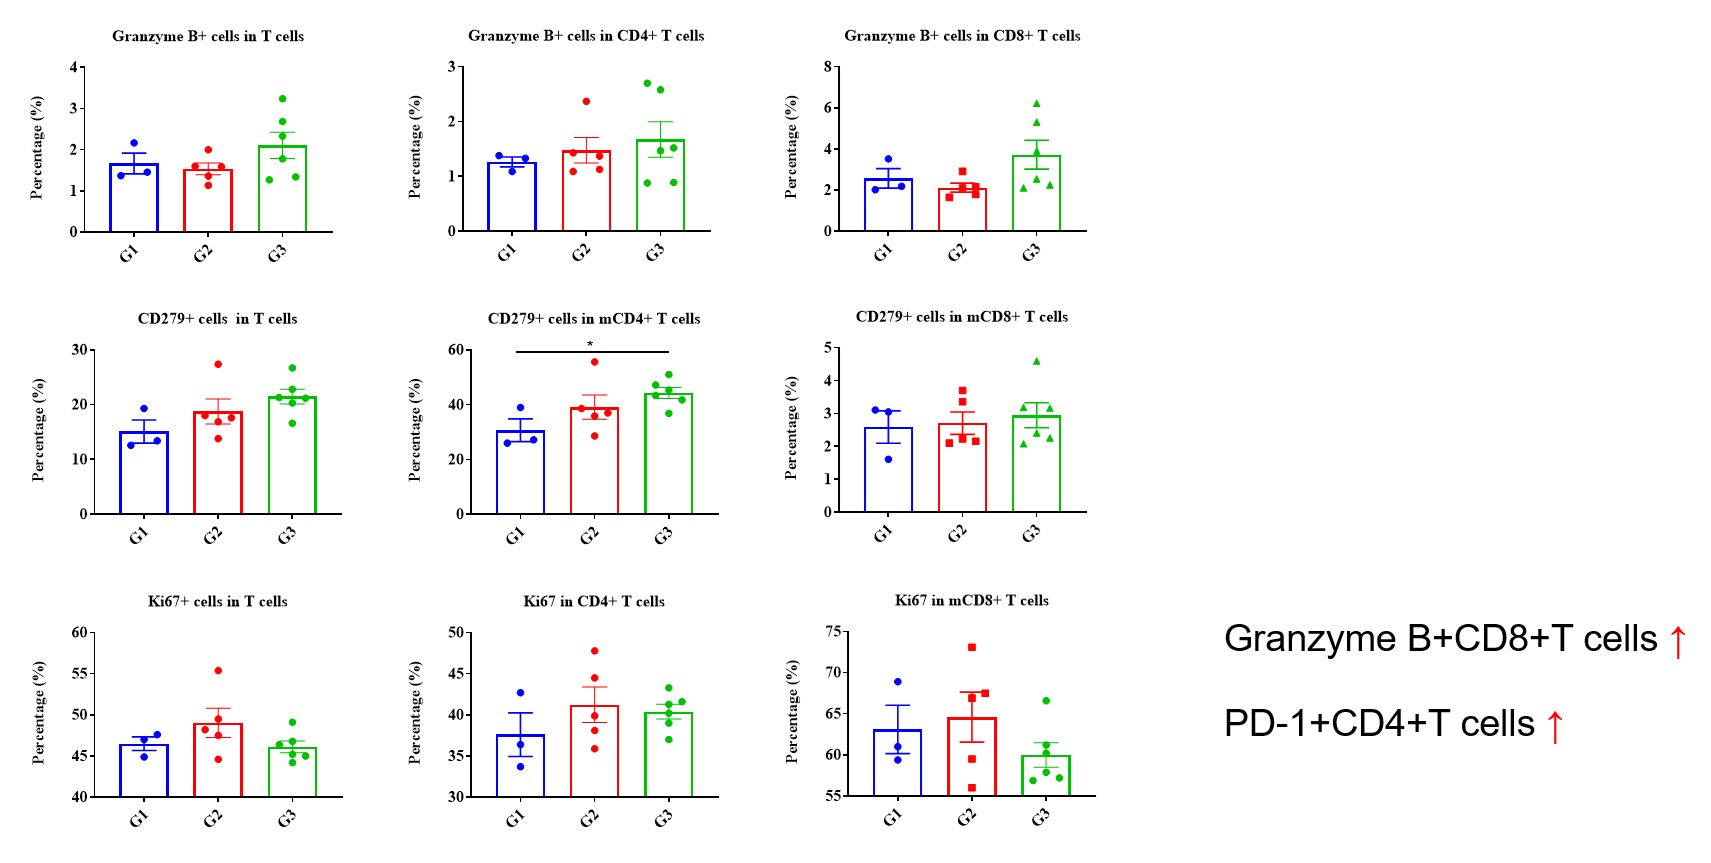
Granzyme B+, CD279+, Ki67+ in T cell Subgroups of Tumor
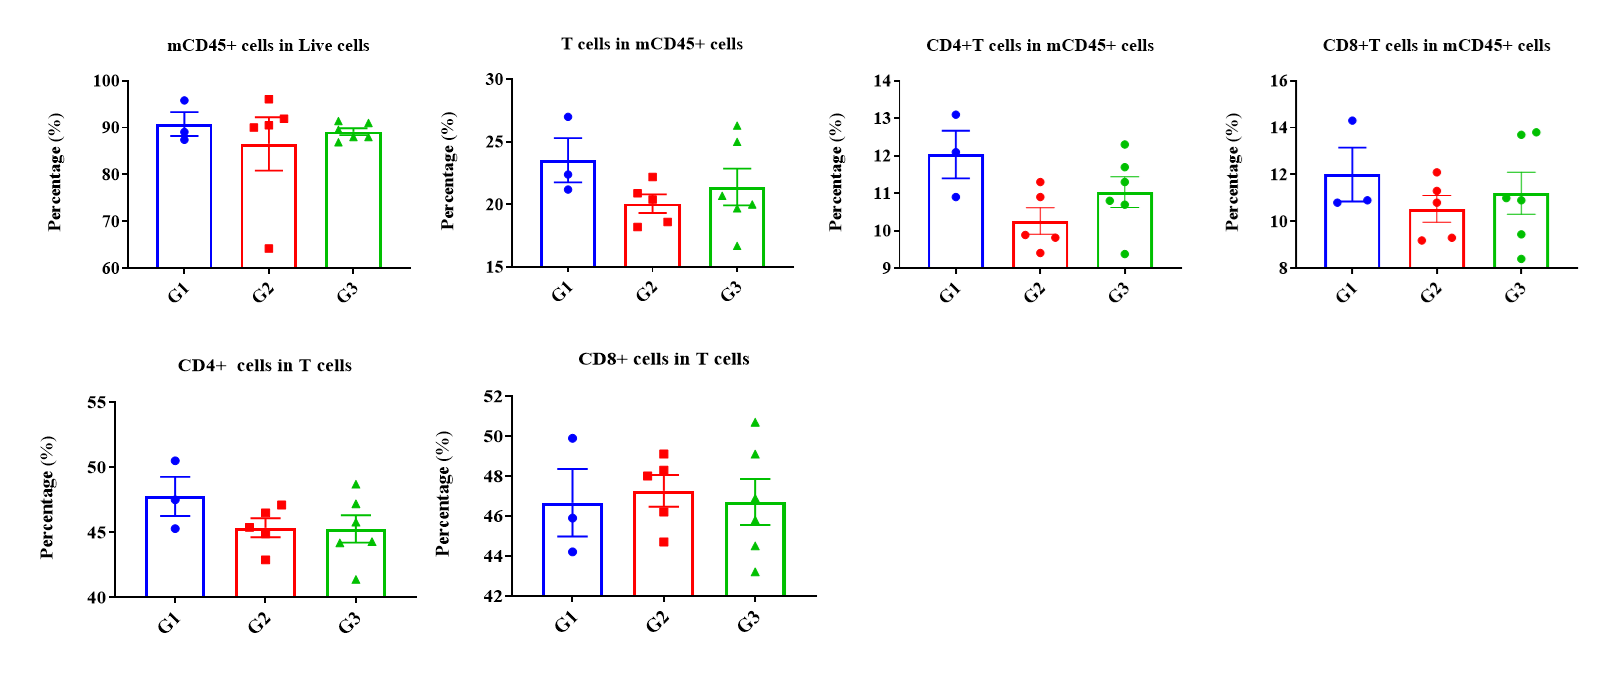
CD45+ cells and T cell Subgroups in Spleen
Values are expressed as mean ± SEM. P value was analyzed by Ordinary one-way ANOVA analysis. P*<0.05;P**<0.01,P***<0.001
Granzyme B+, CD279+, Ki67+ in T cell Subgroups of Spleen
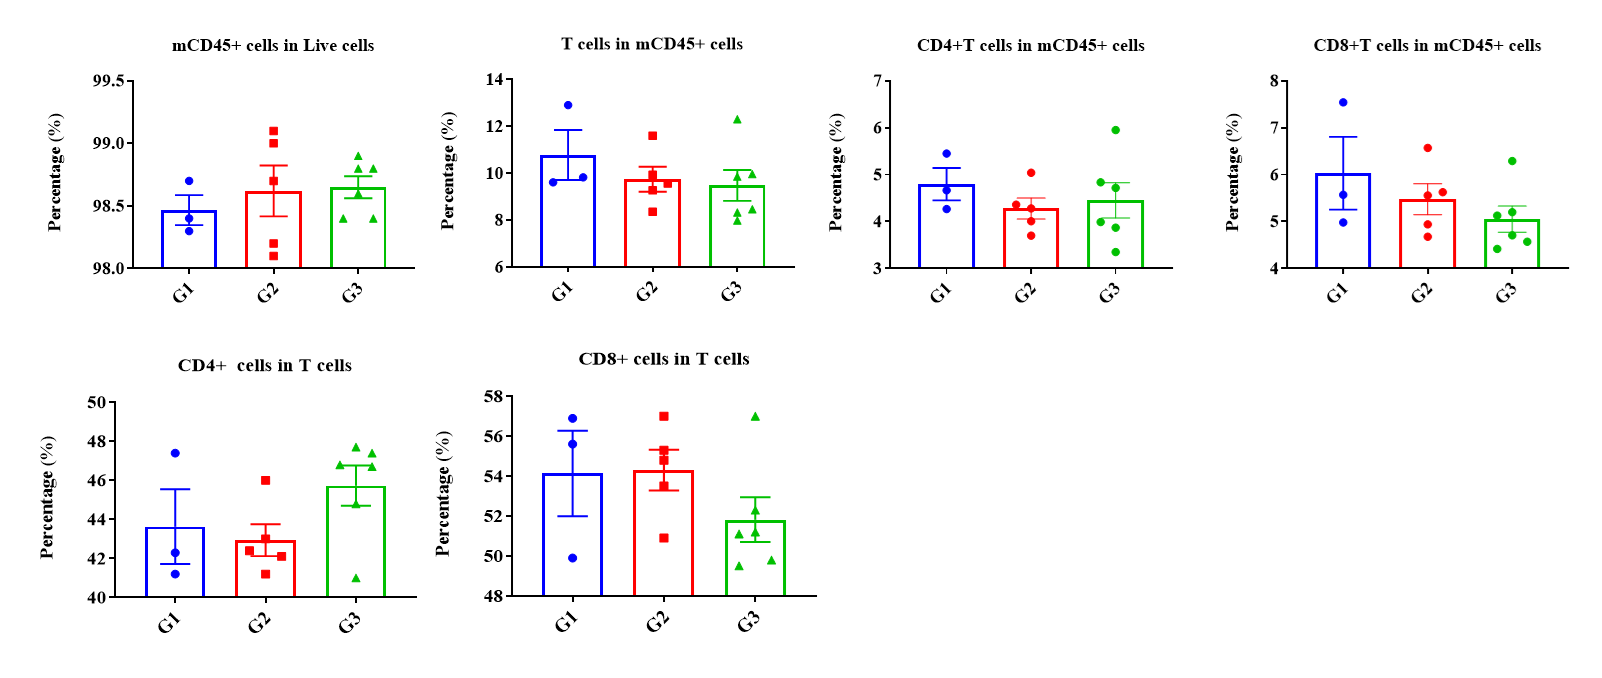
CD45+ Cells and T cell Subgroups in Blood
Values are expressed as mean ± SEM. P value was analyzed by Ordinary one-way ANOVA analysis. P*<0.05;P**<0.01,P***<0.001
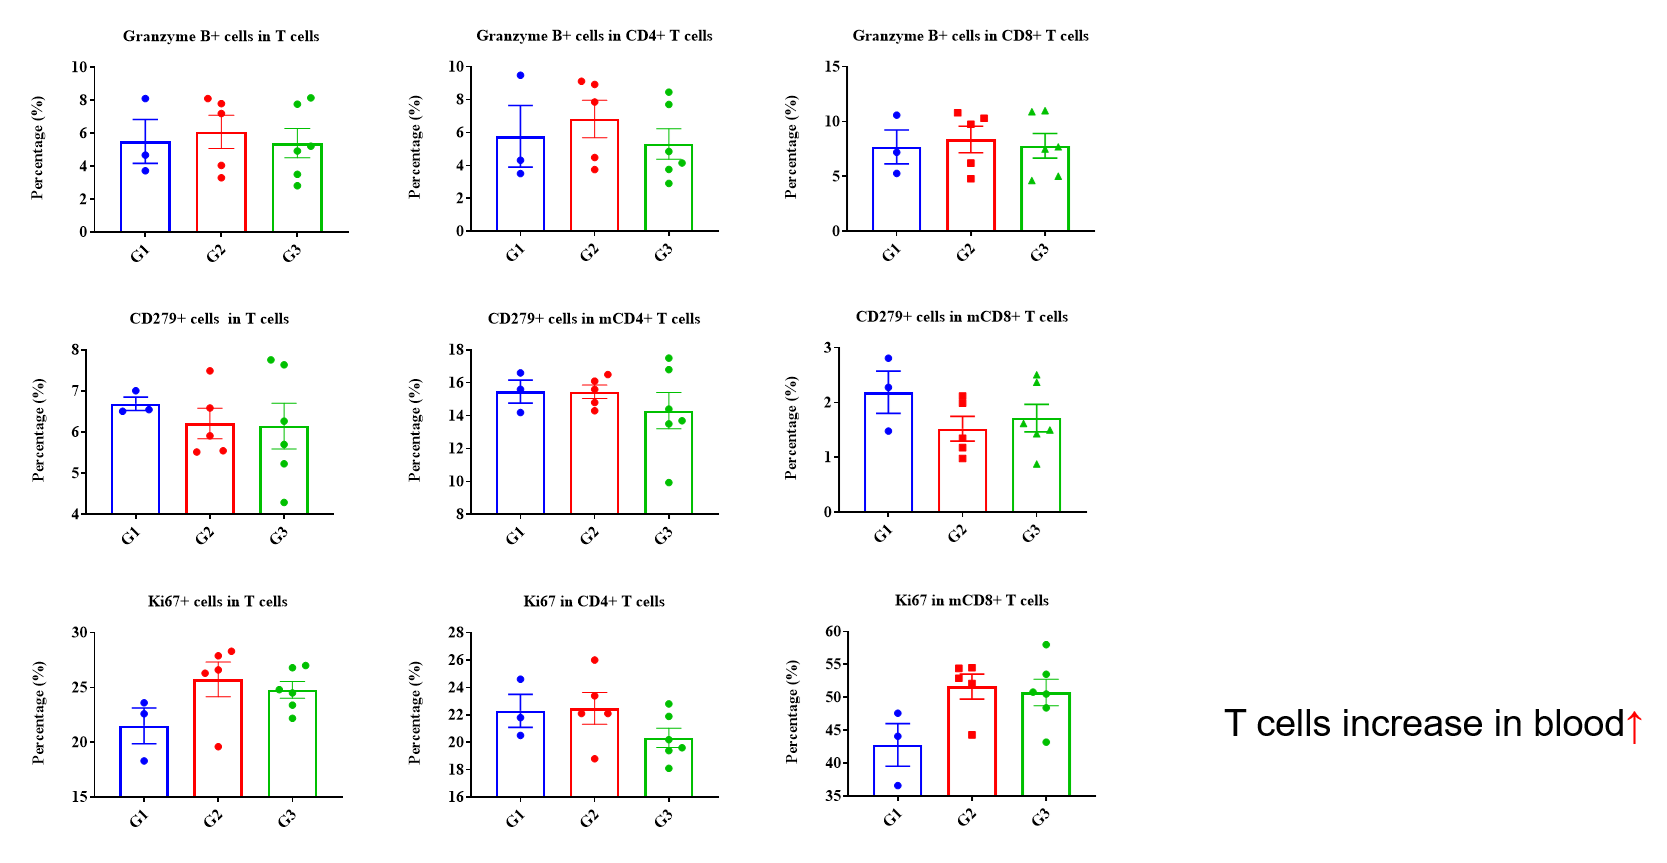
Granzyme B+, CD279+, Ki67+ in T cell Subgroups of Blood
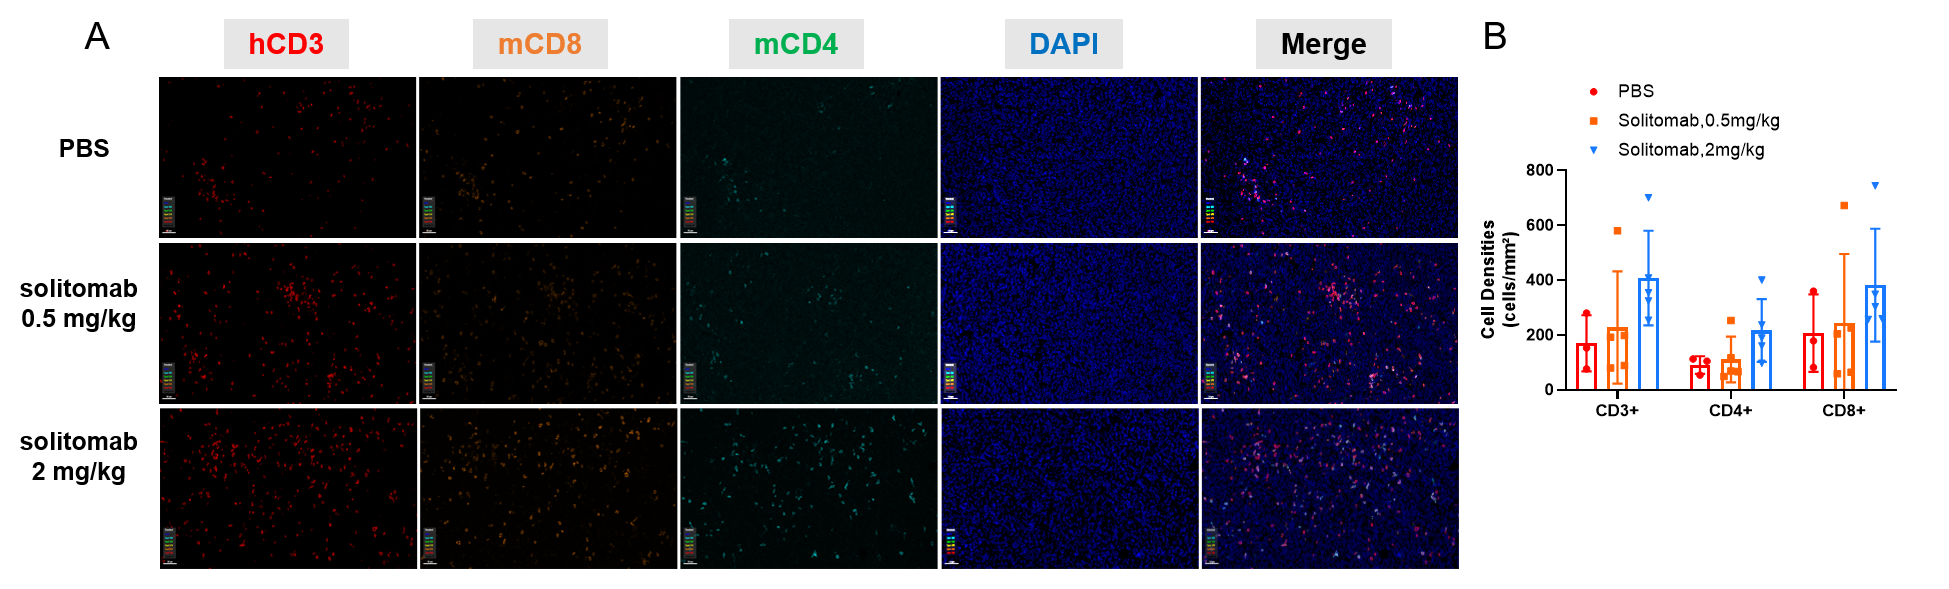
Tumor-infiltrating CD3+, CD8+ and CD4+ T cells
Multiplex immunohistochemical (mIHC) analysis of the tumor-immune microenvironment. (A) Representative image of tumor sections from all groups stained for CD3+ T cells (red), CD8+ T cells (orange), CD4+ T cells (green) and DAPI (nuclei, blue) using an automated mIHC platform (Akoya Biosciences). The merged image reveals the spatial co-localization and distribution of tumor cells and immune cell subsets. (B) Quantification of cell densities (cells/mm²) for each marker within the tumor. An increase in T-cell infiltration was observed in the treatment group. Scale bars: 50µm (A), Data are given as mean±SD (n=3 or 5). Significance was determined by one way ANOVA. *P < 0.05, **P < 0.01, ***P < 0.001.
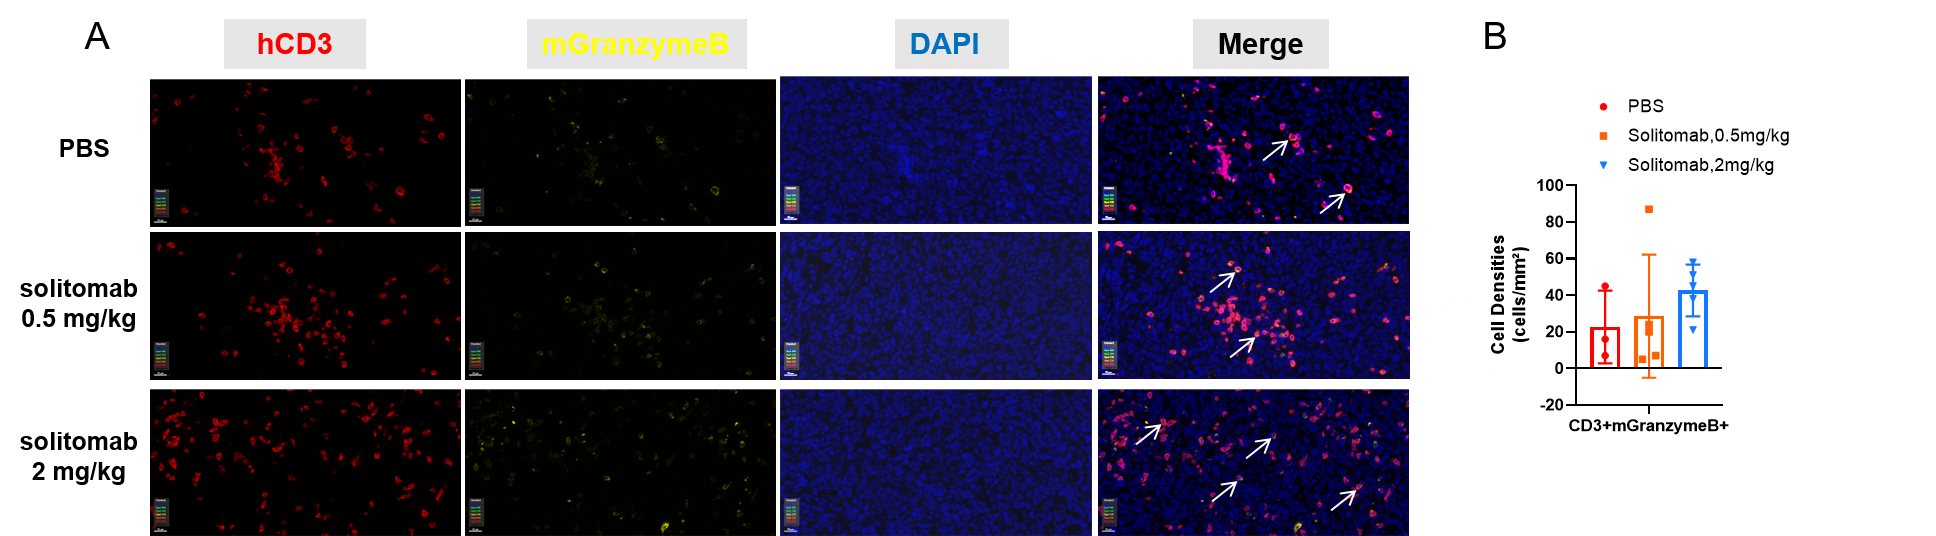
Tumor-infiltrating CD3+ mGranzymeB+ T cells
Multiplex immunohistochemical (mIHC) analysis of the tumor-immune microenvironment. (A) Representative image of tumor sections from all groups stained for CD3+ T cells (red), mGranzymeB+ (yellow), and DAPI (nuclei, blue) using an automated mIHC platform (Akoya Biosciences). The merged image reveals the spatial co-localization and distribution of tumor cells and immune cell subsets. (B) Quantification of cell densities (cells/mm²) for each marker within the tumor. Effector T cells with cytotoxic killing activity showed an increasing trend in the treatment group, but the difference was not statistically significant. Scale bars: 20µm (A), Data are given as mean±SD (n=3 or 5). Significance was determined by one way ANOVA. *P < 0.05, **P < 0.01, ***P < 0.001.
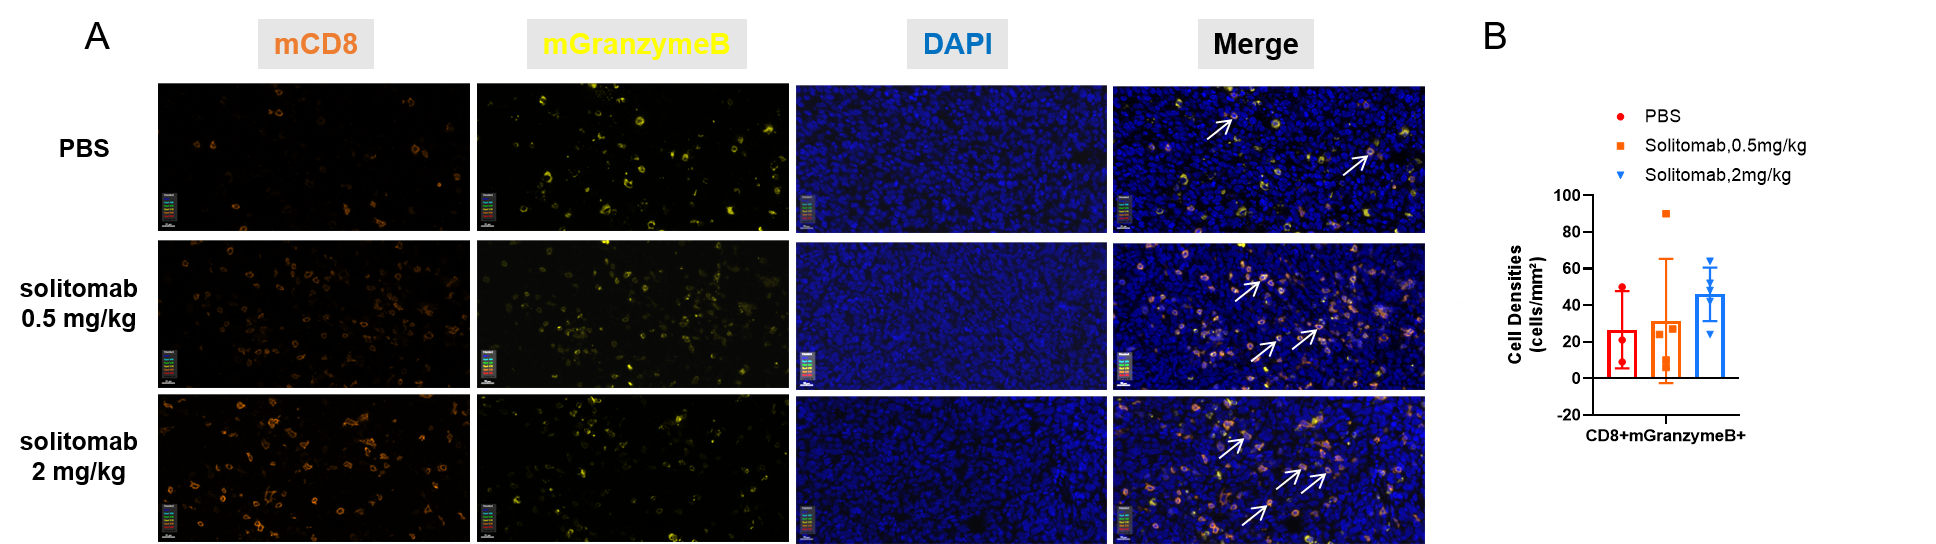
Tumor-infiltrating CD8+ mGranzymeB+ T cells
Multiplex immunohistochemical (mIHC) analysis of the tumor-immune microenvironment. (A) Representative image of tumor sections from all groups stained for CD8+ T cells (organge), mGranzymeB+ (yellow), and DAPI (nuclei, blue) using an automated mIHC platform (Akoya Biosciences). The merged image reveals the spatial co-localization and distribution of tumor cells and immune cell subsets. (B) Quantification of cell densities (cells/mm²) for each marker within the tumor. Cytotoxic effector T lymphocytes showed an increasing trend in the treatment group, but the difference was not statistically significant. Scale bars: 20µm (A), Data are given as mean±SD (n=3 or 5). Significance was determined by one way ANOVA. *P < 0.05, **P < 0.01, ***P < 0.001.
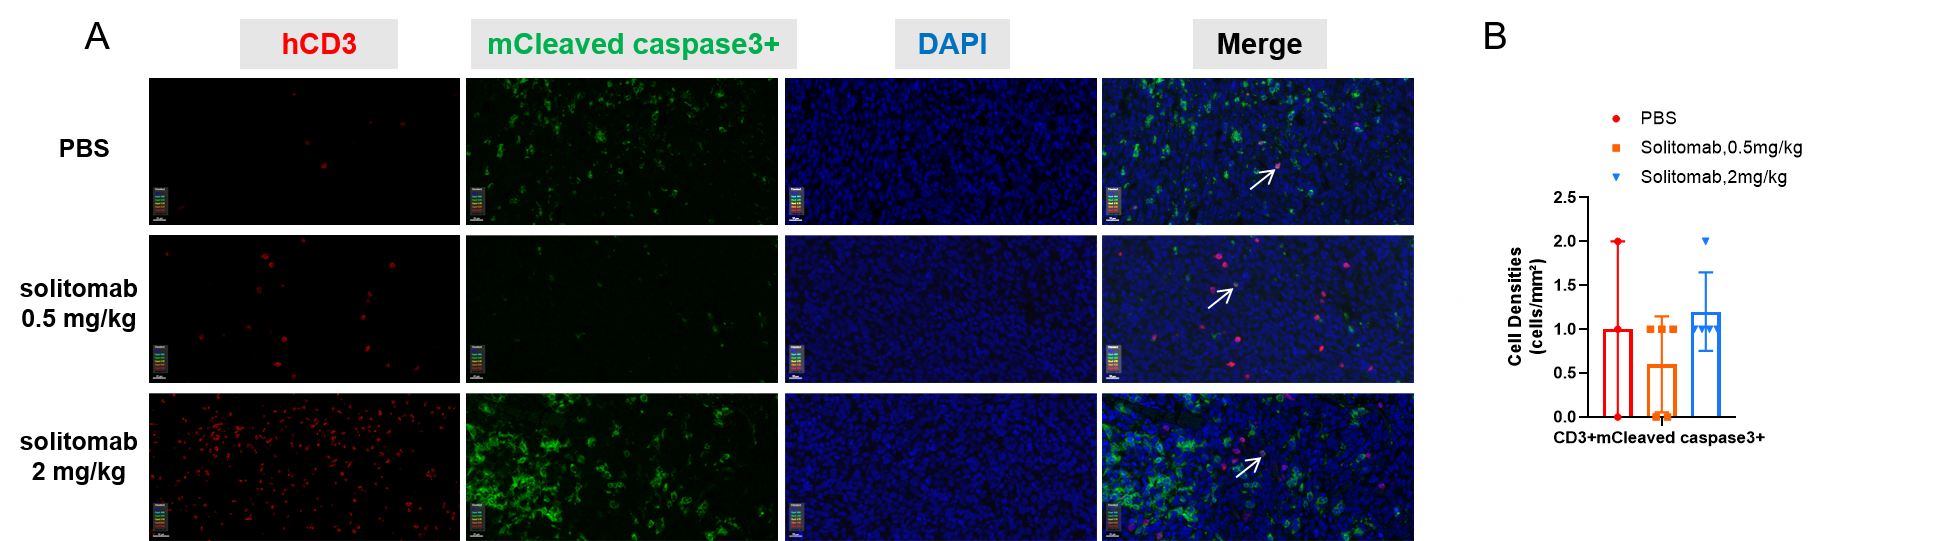
Tumor-infiltrating CD3+ mCleaved caspase3+ T cells
Multiplex immunohistochemical (mIHC) analysis of the tumor-immune microenvironment. (A) Representative image of tumor sections from all groups stained for CD3+ T cells (red), mCleaved caspase3+ (green), and DAPI (nuclei, blue) using an automated mIHC platform (Akoya Biosciences). The merged image reveals the spatial co-localization and distribution of tumor cells and immune cell subsets. (B) Quantification of cell densities (cells/mm²) for each marker within the tumor. The proportion of apoptotic T lymphocytes did not differ significantly among the groups. Scale bars: 20µm (A), Data are given as mean±SD (n=3 or 5). Significance was determined by one way ANOVA. *P < 0.05, **P < 0.01, ***P < 0.001.
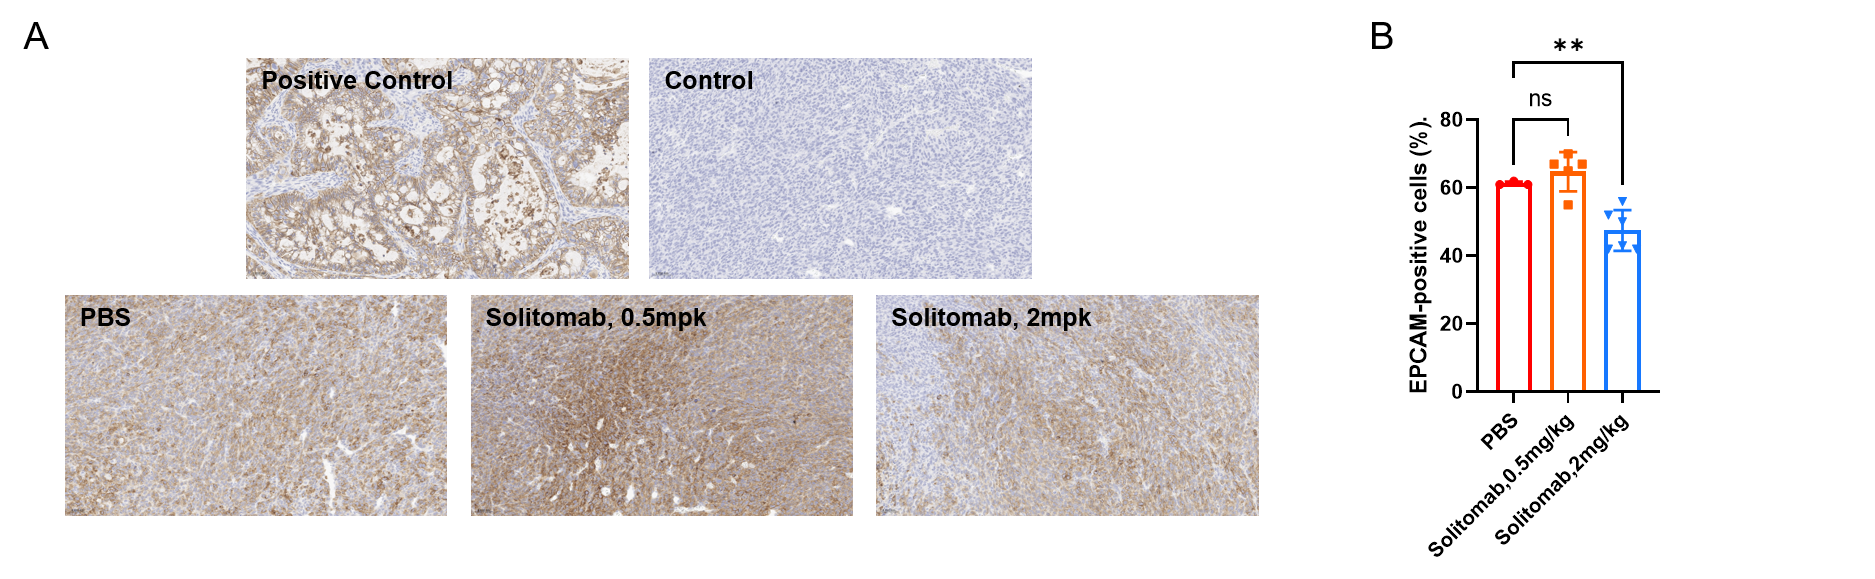
Immunohistochemical Detection of Human EPCAM in Tumor Tissue
Expression and Localization of EPCAM in Tumor Tissue. (A) Representative image of tumor sections from all groups stained for human EPCAM (Novus Biologicals, NBP3-20379) using an automated IHC platform (Leica-Aperio GT450). Human EPCAM exhibits strong positive expression in tumor cells (brown DAB signal), localized to the cell membrane and cytoplasm. Magnification: 400x. (B) Percentage of EPCAM-positive cells (%). Data are given as mean±SD (n=3 or 5). Significance was determined by one way ANOVA. *P < 0.05, **P < 0.01, ***P < 0.001.
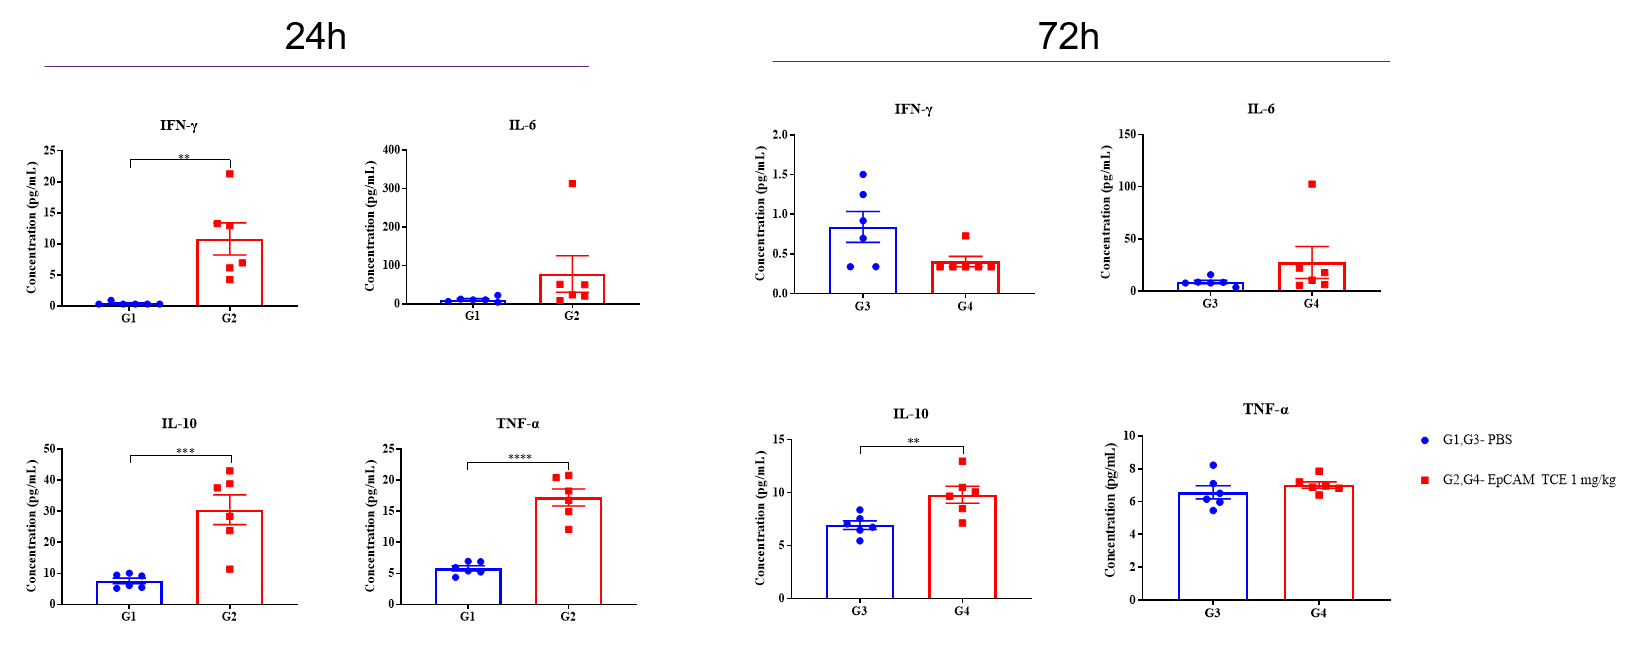
In vivo Effects of an EpCAM TCE on B-hCD3EDG/hEPCAM mice
An EPCAM TCE induced cytokine release in B-hCD3E/hEPCAM mice. B-hCD3E/hEPCAM mice (female, n=6) received a single intravenous administration of the antibody on day 0. Serum cytokine levels were measured using Meso Scale Discovery (MSD) assay at 24 and 72 hours post-dosing. Data are presented as mean ± SEM. Statistical significance was determined by unpaired T-test (*P < 0.05, **P < 0.01, ***P < 0.001, ****P<0.0001). This study was conducted in collaboration with the client.
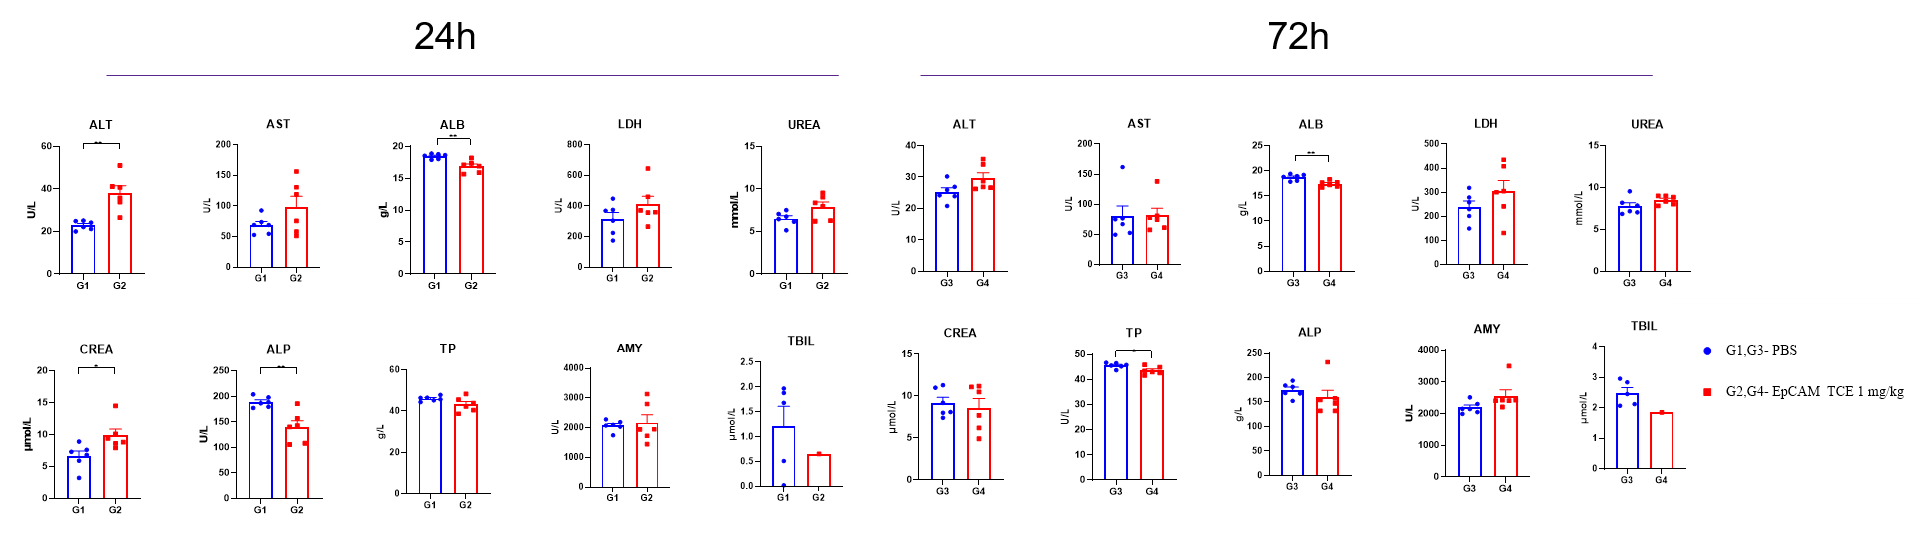
Clinical chemistry analysis of an EPCAM TCE was performed in B-hCD3E/hEPCAM mice. Animals received a single intravenous administration of the antibody (red) on day 0. Blood samples were collected for biochemical analysis. Data are presented as mean±SEM. Statistical significance was assessed by unpaired T-test (*p < 0.05, **p < 0.01). This study was conducted in collaboration with the client.
Histopathological Analysis
Table. H&E results of all tissues in 24h
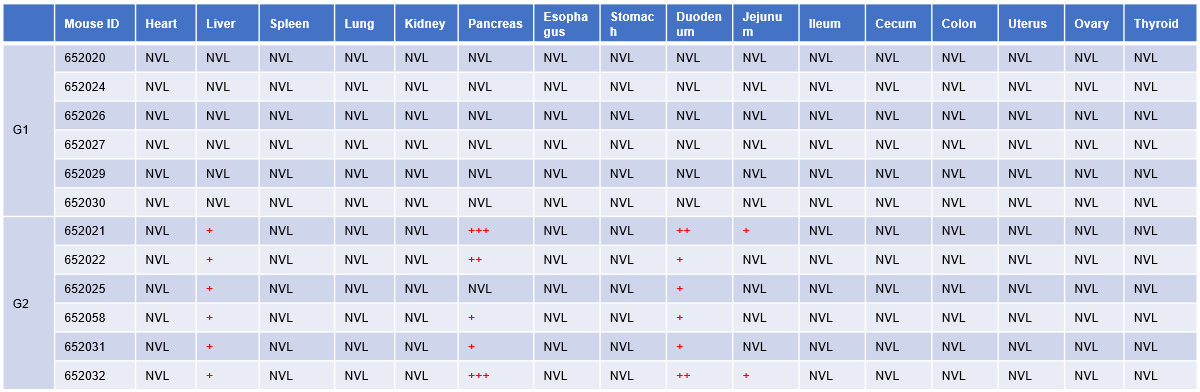
Microscopic observation:All tissue slides were examined histopathological. G1 mice were dosed PBS. G2 mice were dosed an EpCAM TCE. The Four-Grades is used for lesion assessments: minimal (+), slight (++), moderate (+++), and severe (++++). Article-related microscopic changes were observed in liver, pancreas, duodenum and jejunum in G2 mice euthanized at 24 hour and no visible lesions were found in mice euthanized at 72 hour (data not shown), which indicates the above alterations may be transient.
Inflammatory cells infiltration (minimal, 6/6) in liver and reduced secretion in pancreas exocrine glands (5/6, minimal 2/5; slight 1/5; moderate 2/5) indicative of drug-induced changes were observed. Duodenum (6/6, minimal 4/6; slight 2/6) and jejunum (minimal, 2/6) were also noted which were considered to be secondary changes resulting from insufficient secretion of the pancreas. There were no other significant lesions in G1 mice and other organs from G2 mice in microscopic observation. This study was conducted in collaboration with the client.
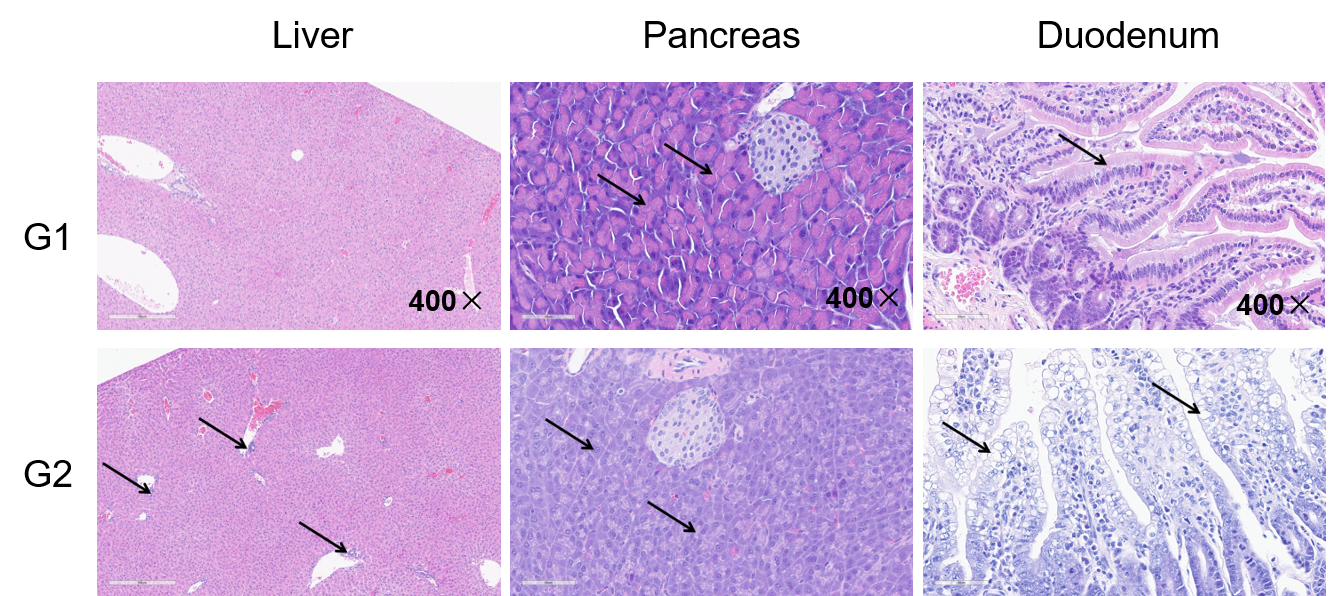
Representative tissue sections of liver, pancreas, and duodenum from B-hCD3EDG/hEPCAM mice dosed PBS (G1) or EpCAM TCE (G2) are shown. Tissues were fixed in 10% neutral buffered formalin and embedded in paraffin. Sections were stained with hematoxylin and eosin (H&E) for morphological evaluation. Images demonstrate that under normal conditions, pancreatic acinar cells exhibit abundant cytoplasm with strong eosinophilia. The basolateral cytoplasm appears blue-purple due to the abundance of rough endoplasmic reticulum (responsible for zymogen synthesis), while the apical cytoplasm is filled with zymogen granules showing bright eosinophilic (pink) granular staining with H&E. Reduced secretory function is characterized by smaller, paler, or absent eosinophilic granules (pink) and increased basophilia (blue) throughout the acinar cell cytoplasm. The liver exhibits inflammatory cell infiltration. The duodenum shows vacuolation of enterocytes. This study was conducted in collaboration with the client.
* When publishing results obtained using this animal model, please acknowledge the source as follows: The animal model [B-hCD3EDG/hEPCAM mice] (Cat# 113797) was purchased from Biocytogen.