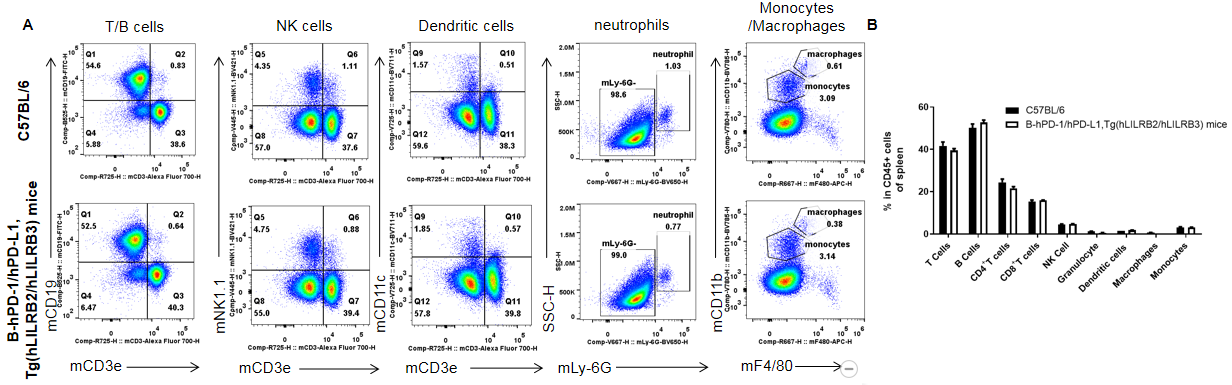
Analysis of leukocytes cell subpopulation in spleen
Analysis of spleen leukocyte subpopulations by FACS. Splenocytes were isolated from female C57BL/6 and B-hPD-1/hPD-L1, Tg(hLILRB2/hLILRB3) mice(n=3, 7-week-old). Flow cytometry analysis of the splenocytes was performed to assess leukocyte subpopulations. A. Representative FACS plots. Single live cells were gated for the CD45+ population and used for further analysis as indicated. B. Results of FACS analysis. The percentages of T cells, B cells, NK cells, dendritic cells, neutrophils, monocytes, and macrophages in B-hPD-1/hPD-L1,Tg(hLILRB2/hLILRB3) mice were similar to those in the C57BL/6 mice. Values are expressed as mean ± SEM.
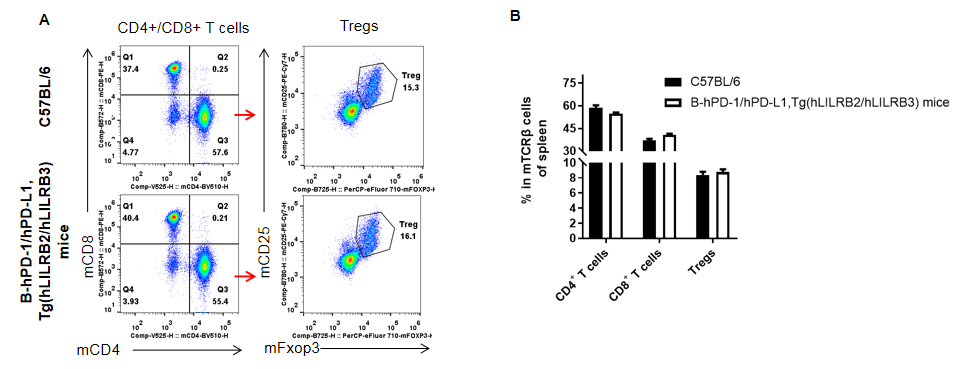
Analysis of T cell subpopulation in spleen
Analysis of spleen T cell subpopulations by FACS. Splenocytes were isolated from female C57BL/6 and B-hPD-1/hPD-L1, Tg(hLILRB2/hLILRB3) mice(n=3, 7-week-old). Flow cytometry analysis of the splenocytes was performed to assess leukocyte subpopulations. A. Representative FACS plots. Single live CD45+ cells were gated for TCRβ+ T cell population and used for further analysis as indicated. B. Results of FACS analysis. The percentages of CD8+ T cells, CD4+ T cells, and Tregs in B-hPD-1/hPD-L1,Tg(hLILRB2/hLILRB3) mice were similar to those in the C57BL/6 mice. Values are expressed as mean ± SEM.
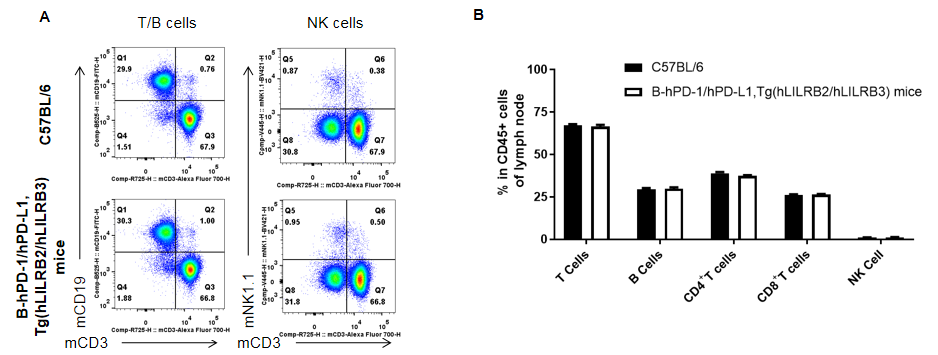
Analysis of leukocytes cell subpopulation in lymph node
Analysis of lymph node leukocyte subpopulations by FACS. Leukocytes were isolated from female C57BL/6 and B-hPD-1/hPD-L1, Tg(hLILRB2/hLILRB3) mice(n=3, 7-week-old). Flow cytometry analysis of the leukocytes was performed to assess leukocyte subpopulations. A. Representative FACS plots. Single live cells were gated for CD45+ population and used for further analysis as indicated. B. Results of FACS analysis. The percentages of T cells, B cells, and NK cells in B-hPD-1/hPD-L1,Tg(hLILRB2/hLILRB3) mice were similar to those in the C57BL/6 mice. Values are expressed as mean ± SEM.
Analysis of T cell subpopulation in lymph node
Analysis of lymph node T cell subpopulations by FACS. Leukocytes were isolated from female C57BL/6 and B-hPD-1/hPD-L1, Tg(hLILRB2/hLILRB3) mice(n=3, 7-week-old). Flow cytometry analysis of the leukocytes was performed to assess leukocyte subpopulations. A. Representative FACS plots. Single live CD45+ cells were gated for TCRβ+ T cell population and used for further analysis as indicated. B. Results of FACS analysis. The percentages of CD8+ T cells, CD4+ T cells, and Tregs in B-hPD-1/hPD-L1,Tg(hLILRB2/hLILRB3) mice were similar to those in the C57BL/6 mice. Values are expressed as mean ± SEM.
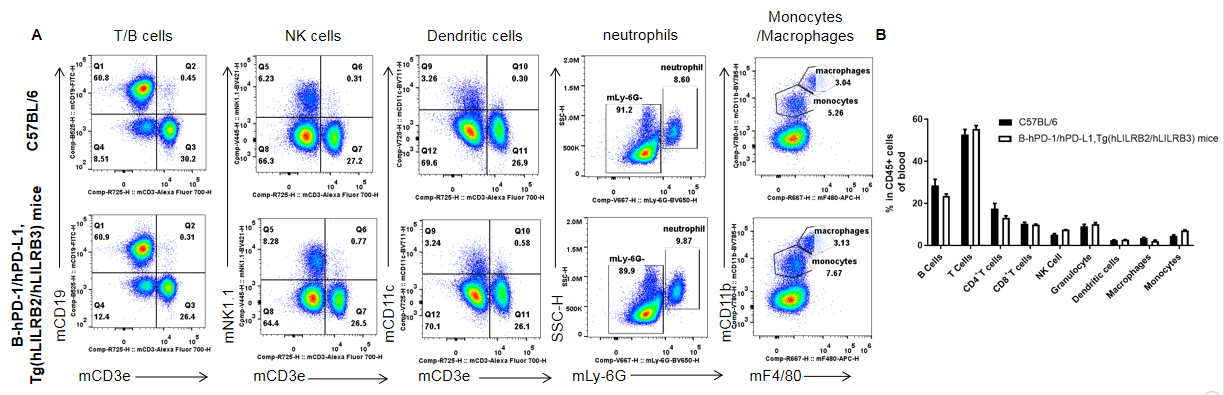
Analysis of leukocytes cell subpopulation in blood
Analysis of blood leukocyte subpopulations by FACS. Leukocytes were isolated from female C57BL/6 and B-hPD-1/hPD-L1,Tg(hLILRB2/hLILRB3) mice(n=3, 7-week-old). Flow cytometry analysis of the blood was performed to assess leukocyte subpopulations. A. Representative FACS plots. Single live cells were gated for the CD45+ population and used for further analysis as indicated here. B. Results of FACS analysis. The percentages of T cells, B cells, NK cells, dendritic cells, neutrophils, monocytes, and macrophages in B-hPD-1/hPD-L1,,Tg(hLILRB2/hLILRB3) mice were similar to those in the C57BL/6 mice. Values are expressed as mean ± SEM.
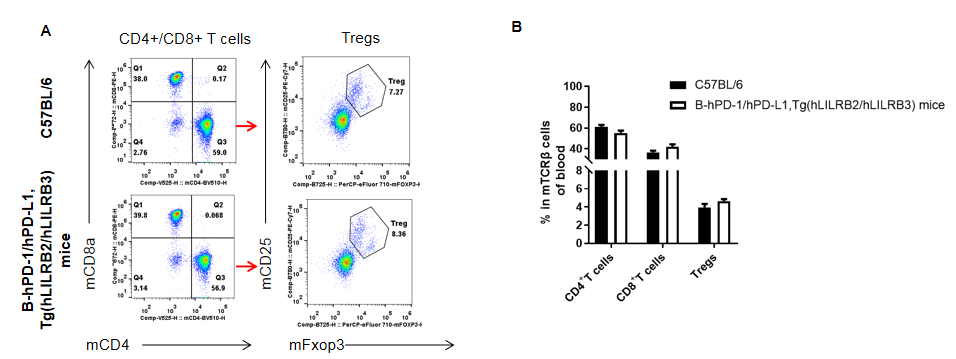
Analysis of T cell subpopulation in blood
Analysis of blood T cell subpopulations by FACS. Leukocytes were isolated from female C57BL/6 and B-hPD-1/hPD-L1, Tg(hLILRB2/hLILRB3) mice(n=3, 7-week-old). Flow cytometry analysis of the blood was performed to assess leukocyte subpopulations. A. Representative FACS plots. Single live CD45+ cells were gated for TCRβ+ T cell population and used for further analysis as indicated. B. Results of FACS analysis. The percentages of CD8+ T cells, CD4+ T cells, and Tregs in B-hPD-1/hPD-L1,Tg(hLILRB2/hLILRB3) mice were similar to those in the C57BL/6 mice. Values are expressed as mean ± SEM.
* When publishing results obtained using this animal model, please acknowledge the source as follows: The animal model [B-hPD-1/hPD-L1, Tg(hLILRB2/hLILRB3) mice] (Cat# 111954) was purchased from Biocytogen.