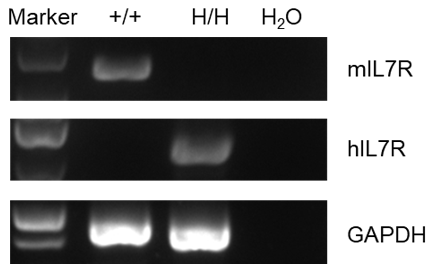
mRNA expression analysis
Strain specific analysis of IL7R gene expression in wild-type C57BL/6 mice and B-hIL7R mice by RT-PCR. Mouse Il7r mRNA was detectable only in splenocytes of wild-type C57BL/6 mice (+/+). Human IL7R mRNA was detectable only in homozygous B-hIL7R mice (H/H), but not in wild-type mice.
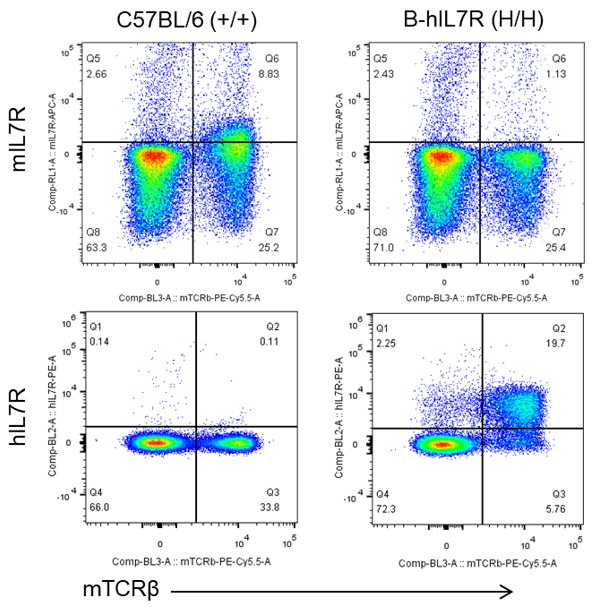
Protein expression analysis
Strain specific IL7R expression analysis in homozygous B-hIL7R mice by flow cytometry. Splenocytes were collected from wild-type C57BL/6 mice (+/+) and homozygous B-hIL7R mice (H/H), and analyzed by flow cytometry with species-specific anti-IL7R antibody. Mouse IL7R was detectable in wild type C57BL/6 mice (+/+). Human IL7R was exclusively detectable in homozygous B-hIL7R mice but not in wild-type mice.
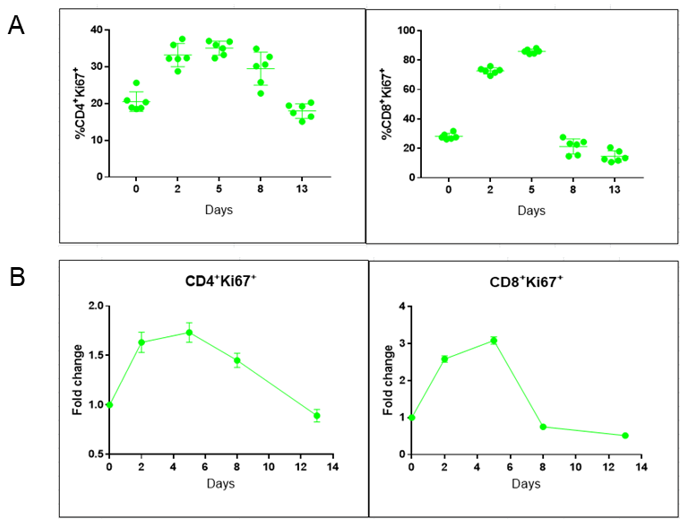
Proliferation analysis of T cells
Assessment of T cell proliferation (Ki-67) in B-hIL7R mice. Human IL7 was intraperitoneally injected into B-hIL7R mice. Blood was collected before IL7 injection and on day2, day5, day8, day13 after injection. Percentages of CD4+ Ki67+ T cells and CD8+ Ki67+ T cells were analyzed with flow cytometry (A). The change fold was shown in (B). Proliferation of CD4 + T cells and CD8 + T cells was significantly evident after stimulation with human IL7. Results demonstrated that introduction of hIL7R in place of its mouse counterpart does not change the proliferation function of CD4+ T cells and CD8+ T cells in blood.
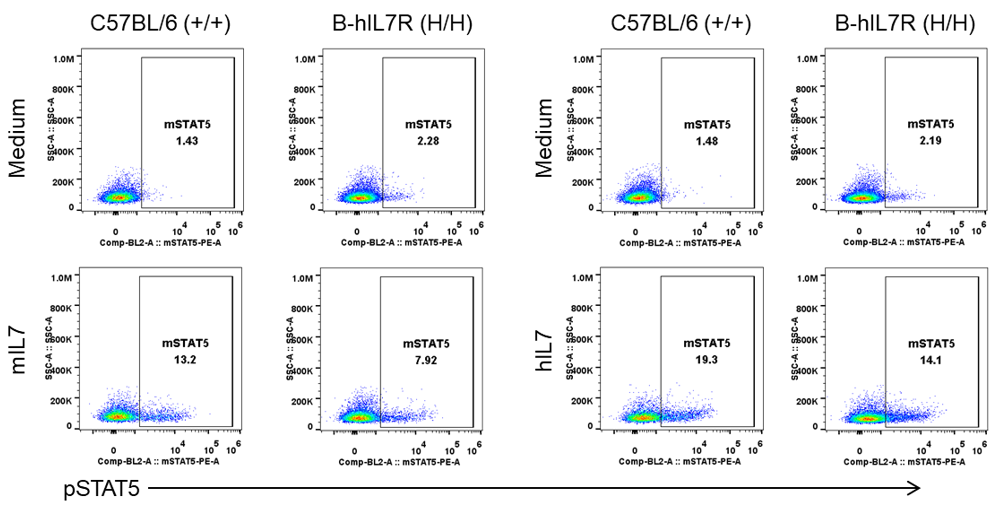
Induction of STAT5 phosphorylation analysis
Mouse pSTAT5 was induced with mouse IL7 and human IL7 in homozygous B-hIL7R mice analyzed by flow cytometry. Splenocytes were collected from wild type C57BL/6 mice (+/+) and homozygous B-hIL7R mice (H/H), and stimulated with culture medium, mIL7 or hIL7. The induction of STAT5 phosphorylation on CD4+ T cells with the indicated stimulators was assayed by flow cytometry. STAT5 phosphorylation was successfully induced with mouse and human IL7 in wild type C57BL/6 mice and homozygous B-hIL7R mice. Results demonstrated that IL7 and IL7R were cross-reactive in mouse and human.
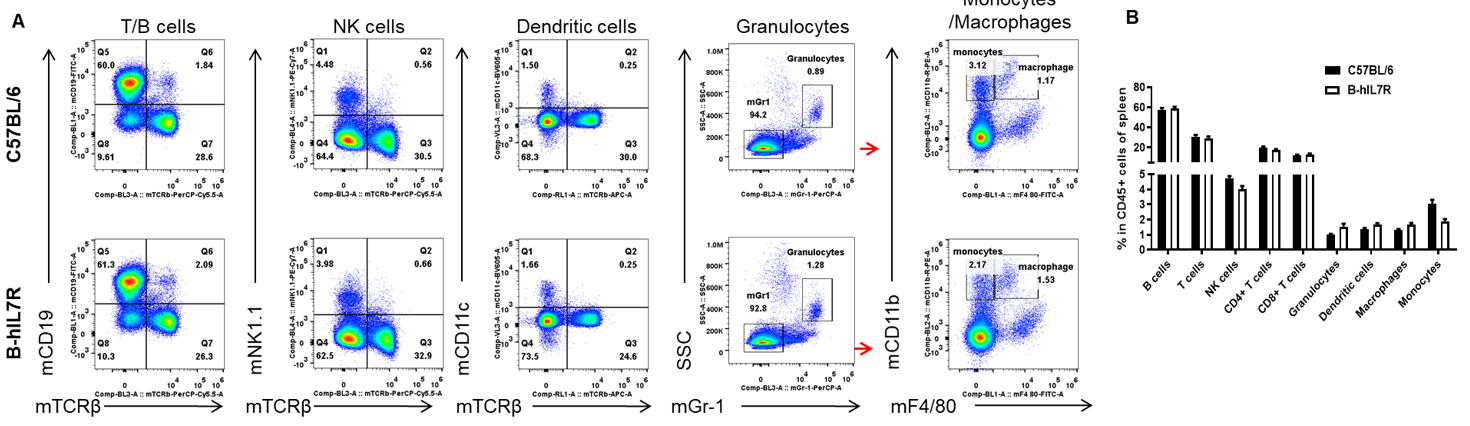
Analysis of leukocytes cell subpopulation in spleen
Analysis of spleen leukocyte subpopulations by FACS. Splenocytes were isolated from female C57BL/6 and B-hIL7R mice (n=3, 10-week-old). Flow cytometry analysis of the splenocytes was performed to assess leukocyte subpopulations. A. Representative FACS plots. Single live cells were gated for the CD45+ population and used for further analysis as indicated here. B. Results of FACS analysis. Percent of T cells, B cells, NK cells, dendritic cells, granulocytes, monocytes and macrophages in homozygous B-hIL7R mice were similar to those in the C57BL/6 mice, demonstrating that IL7R humanized does not change the overall development, differentiation or distribution of these cell types in spleen. Values are expressed as mean ± SEM.
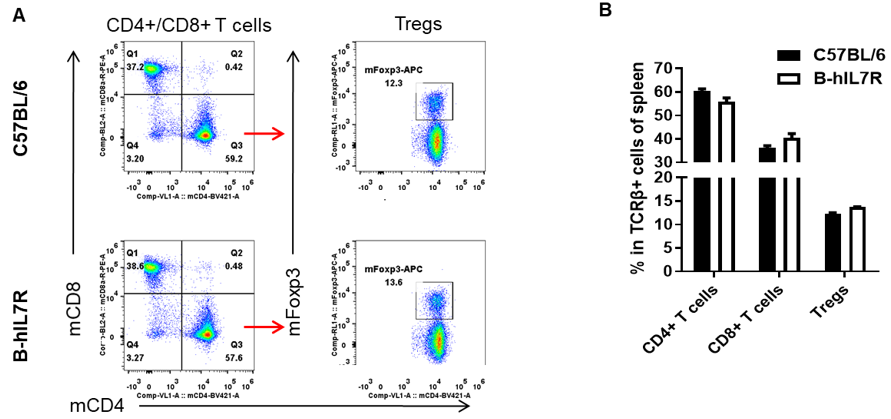
Analysis of T cell subpopulation in spleen
Analysis of spleen T cell subpopulations by FACS. Splenocytes were isolated from female C57BL/6 and B-hIL7R mice (n=3, 10-week-old). Flow cytometry analysis of the splenocytes was performed to assess leukocyte subpopulations. A. Representative FACS plots. Single live CD45+ cells were gated for TCRβ+ T cell population and used for further analysis as indicated here. B. Results of FACS analysis. The percent of CD4+ T cells, CD8+ T cells and Tregs in homozygous B-hIL7R mice were similar to those in the C57BL/6 mice, demonstrating that introduction of hIL7R in place of its mouse counterpart does not change the overall development, differentiation or distribution of these T cell subtypes in spleen. Values are expressed as mean ± SEM.
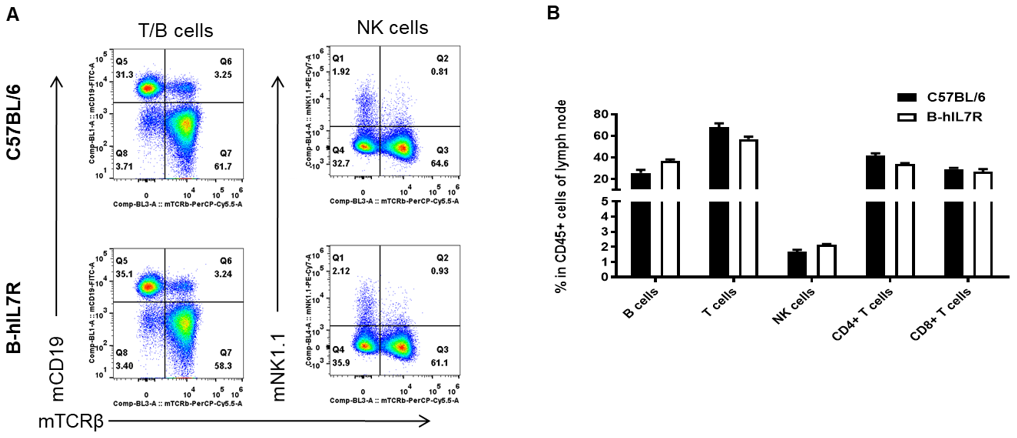
Analysis of leukocytes cell subpopulation in lymph node
Analysis of lymph node leukocyte subpopulations by FACS. Lymph nodes were isolated from female C57BL/6 and B-hIL7R mice (n=3, 10-week-old). Flow cytometry analysis of the leukocytes was performed to assess leukocyte subpopulations. A. Representative FACS plots. Single live cells were gated for the CD45+ population and used for further analysis as indicated here. B. Results of FACS analysis. Percent of T cells, B cells, NK cells, dendritic cells, granulocytes, monocytes and macrophages in homozygous B-hIL7R mice were similar to those in the C57BL/6 mice, demonstrating that IL7R humanized does not change the overall development, differentiation or distribution of these cell types in lymph node. Values are expressed as mean ± SEM.
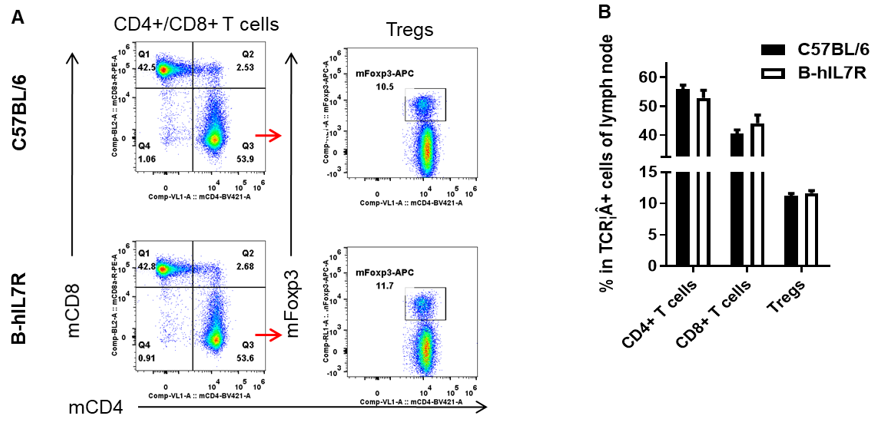
Analysis of T cell subpopulation in lymph node
Analysis of lymph node T cell subpopulations by FACS. Leukocytes were isolated from female C57BL/6 and B-hIL7R mice (n=3, 10-week-old). Flow cytometry analysis of the leukocytes was performed to assess leukocyte subpopulations. A. Representative FACS plots. Single live CD45+ cells were gated for TCRβ+ T cell population and used for further analysis as indicated here. B. Results of FACS analysis. The percent of CD4+ T cells, CD8+ T cells, and Tregs in homozygous B-hIL7R mice were similar to those in the C57BL/6 mice, demonstrating that introduction of hIL7R in place of its mouse counterpart does not change the overall development, differentiation or distribution of these T cell subtypes in lymph node. Values are expressed as mean ± SEM.
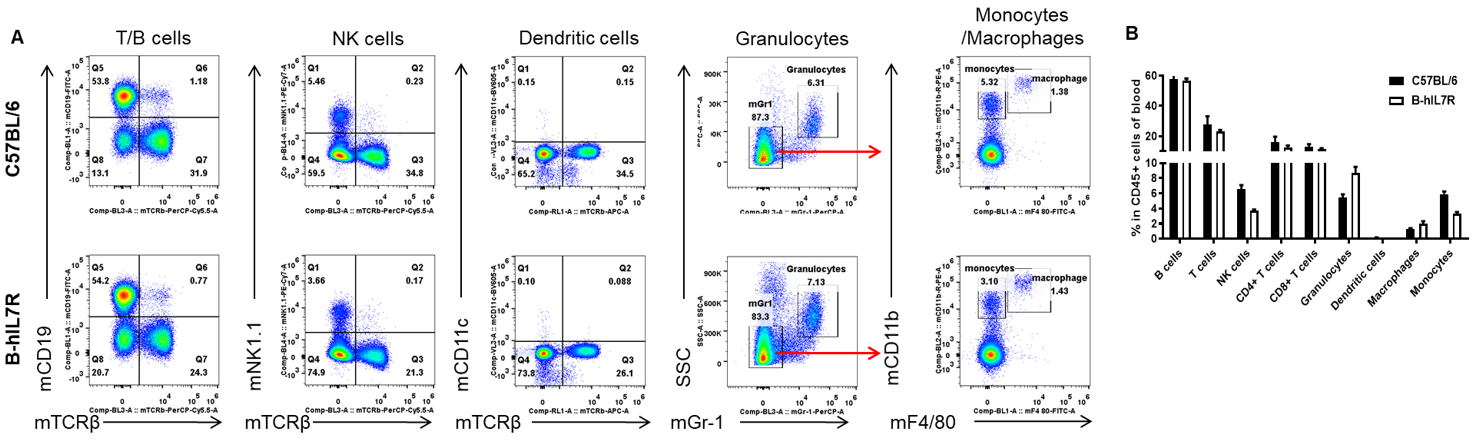
Analysis of leukocytes cell subpopulation in blood
Analysis of blood leukocyte subpopulations by FACS. Blood cells were isolated from female C57BL/6 and B-hIL7R mice (n=3, 10-week-old). Flow cytometry analysis of the blood cells was performed to assess leukocyte subpopulations. A. Representative FACS plots. Single live cells were gated for the CD45+ population and used for further analysis as indicated here. B. Results of FACS analysis. Percent of T cells, B cells, NK cells, dendritic cells, granulocytes, monocytes and macrophages in homozygous B-hIL7R mice were similar to those in the C57BL/6 mice, demonstrating that IL7R humanized does not change the overall development, differentiation or distribution of these cell types in blood. Values are expressed as mean ± SEM.
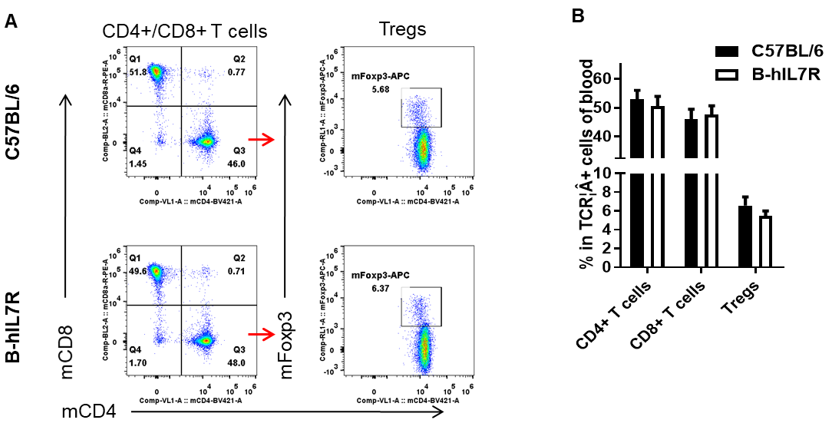
Analysis of T cell subpopulation in blood
Analysis of blood T cell subpopulations by FACS. Blood cells were isolated from female C57BL/6 and B-hIL7R mice (n=3, 10-week-old). Flow cytometry analysis of the blood cells was performed to assess leukocyte subpopulations. A. Representative FACS plots. Single live CD45+ cells were gated for TCRβ+ T cell population and used for further analysis as indicated here. B. Results of FACS analysis. The percent of CD4+ T cells, CD8+ T cells, and Tregs in homozygous B-hIL7R mice were similar to those in the C57BL/6 mice, demonstrating that introduction of hIL7R in place of its mouse counterpart does not change the overall development, differentiation or distribution of these T cell subtypes in blood. Values are expressed as mean ± SEM.
* When publishing results obtained using this animal model, please acknowledge the source as follows: The animal model [B-hIL7R mice] (Cat# 110082) was purchased from Biocytogen.