Description
IFNAR1/IFNAR2: Key receptors to drive the transcription of interferon-stimulated genes (ISGs) for antiviral, antitumor, and immunomodulatory responses
- Gene Information: Interferon alpha and beta receptor subunit 1 (IFNAR1) and interferon alpha and beta receptor subunit 2 (IFNAR2) are protein-coding genes located on chromosome 21q22.11. They encode type I membrane proteins that form two chains of a receptor for interferons alpha and beta.
- Protein Expression: Both IFNAR1 and IFNAR2 are expressed on almost all nucleated cells, with notably high density found on immune cell populations such as T cells, B cells, NK cells, macrophages, and dendritic cells.
- Signaling Pathway: Upon binding type I interferons, IFNAR1 and IFNAR2 heterodimerize, activating the JAK1/Tyk2-dependent STAT1/STAT2 signaling pathway to drive the transcription of interferon-stimulated genes (ISGs) for antiviral, antitumor, and immunomodulatory responses.
- Therapeutic Inhibition: By binding to the IFNAR1 subunit, anifrolumab prevents the formation of the active ternary complex with IFNAR2 and the interferon ligand, blocking all Type I IFN signaling.
Targeting strategy
IFNAR1
- The exons 2-9 of mouse Ifnar1 gene that encode the extracellular region were replaced by human IFNAR1 exons 2-9 in B-hIFNAR1/hIFNAR2 mice.
- The endogenous mouse promoter, 5′ UTR, and 3′ UTR regions are retained, allowing human IFNAR1 expression to be driven by the native mouse Ifnar1 promoter, while endogenous mouse Ifnar1 transcription and translation are abolished.
IFNAR2
- The chimeric CDS consists of human IFNAR2 extracellular domain and mouse Ifnar2 intracellular region was inserted into mouse ifnar2 gene locus in B-hIFNAR1/hIFNAR2 mice.
- The endogenous mouse promoter, 5′ UTR, and 3′ UTR regions are retained, allowing human IFNAR2 expression to be driven by the native mouse Ifnar2 promoter, while endogenous mouse Ifnar2 transcription and translation are abolished.
IFNAR2 Protein Expression in Spleen
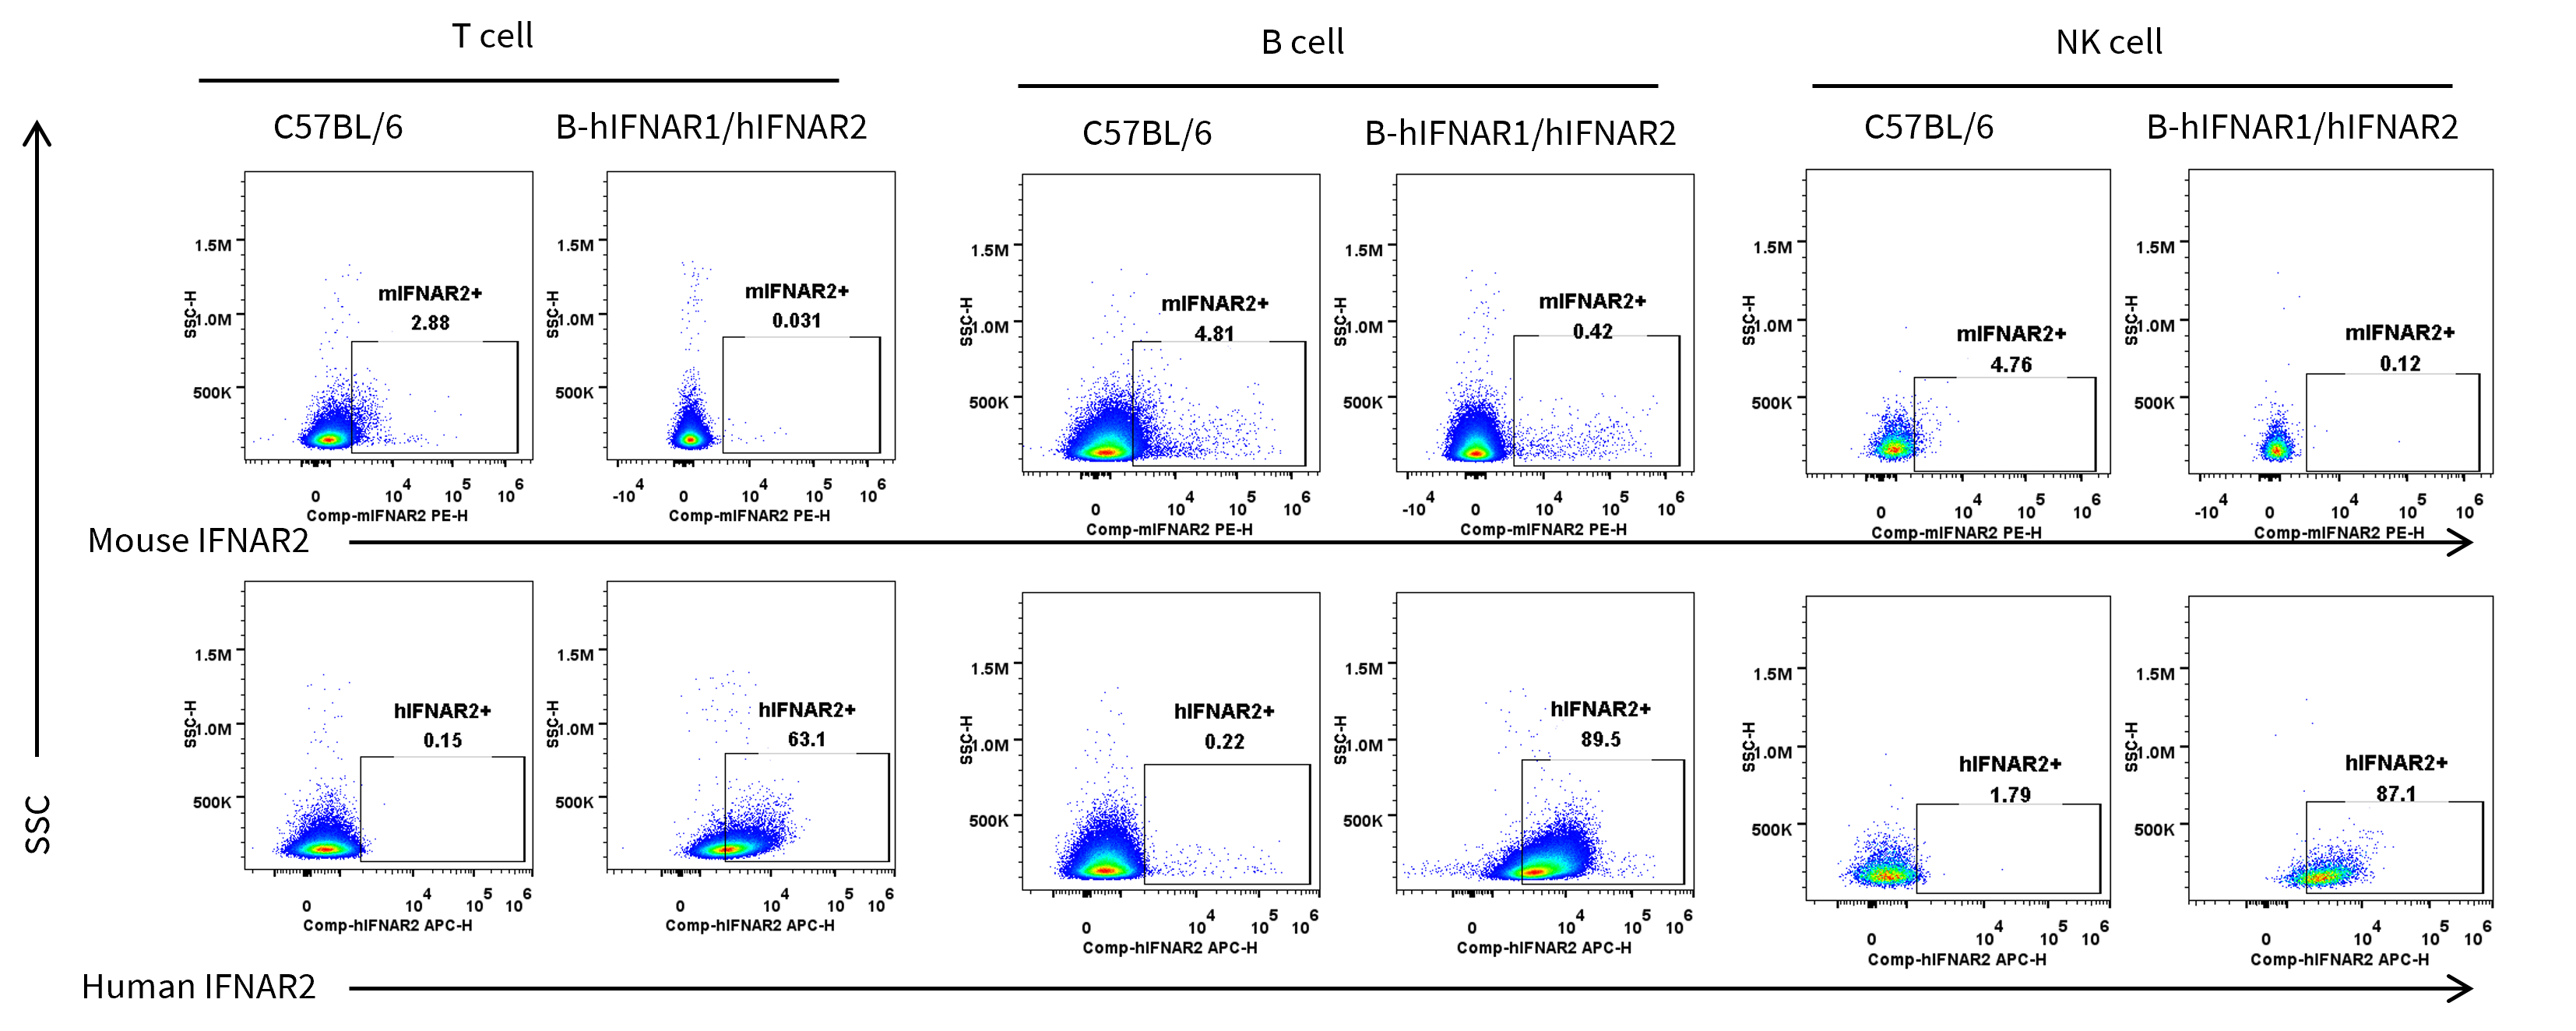
- Mouse IFNAR2 was detected on T cells, B cells, and NK cells in wild-type C57BL/6 mice, but not in B-hIFNAR1/hIFNAR2 mice.
- Human IFNAR2 was detected on T cells, B cells, and NK cells in B-hIFNAR1/hIFNAR2 mice, but not in wild-type C57BL/6 mice.
Mouse and human IFNAR2 expression analysis in wild-type C57BL/6 and B-hIFNAR1/hIFNAR2 mice by flow cytometry. Splenocytes were collected from wild-type C57BL/6 and homozygous B-hIFNAR1/hIFNAR2 mice. Protein expression was analyzed with anti-mouse IFNAR2 antibody (R&D, FAB1083P) and anti-human IFNAR2 antibody (Miltenyi Biotec, 130-099-560) by flow cytometry. Mouse IFNAR2 was detectable exclusively in T cells, B cells, and NK cells of wild-type mice. Human IFNAR2 was detectable in T cells, B cells, and NK cells of B-hIFNAR1/hIFNAR2 mice but not in wild-type mice.
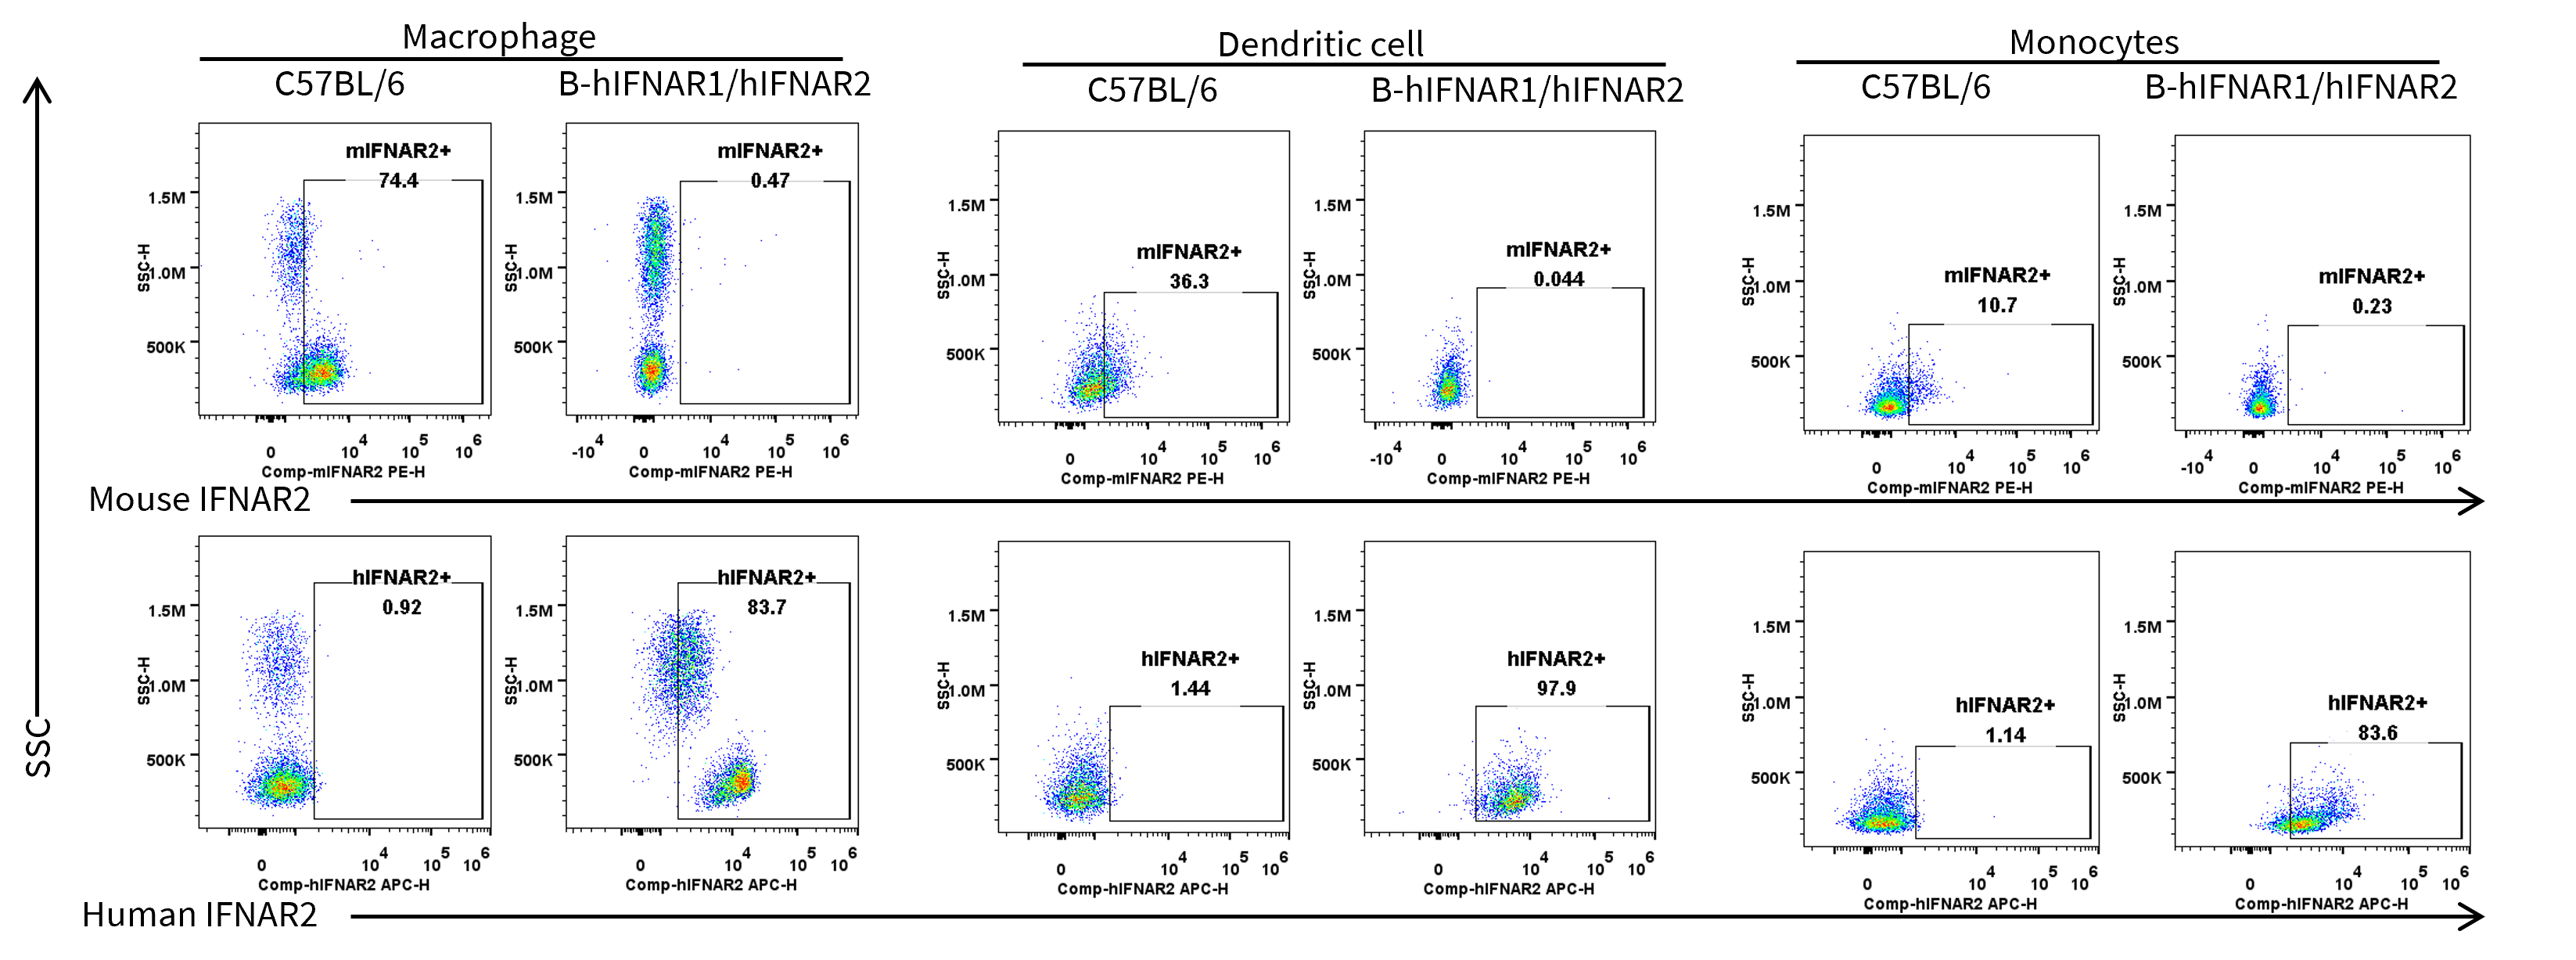
- Mouse IFNAR2 was detected on macrophages, monocytes, and dendritic cells in wild-type C57BL/6 mice, but not in B-hIFNAR1/hIFNAR2 mice.
- Human IFNAR2 was detected on macrophages, monocytes, and dendritic cells in B-hIFNAR1/hIFNAR2 mice, but not in wild-type C57BL/6 mice.
Mouse and human IFNAR2 expression analysis in wild-type C57BL/6 and B-hIFNAR1/hIFNAR2 mice by flow cytometry. Splenocytes were collected from wild-type C57BL/6 and homozygous B-hIFNAR1/hIFNAR2 mice. Protein expression was analyzed with anti-mouse IFNAR2 antibody (R&D, FAB1083P) and anti-human IFNAR2 antibody (Miltenyi Biotec, 130-099-560) by flow cytometry. Mouse IFNAR2 was detectable exclusively in macrophages, monocytes, and dendritic cell of wild-type mice. Human IFNAR2 was detectable in macrophages, monocytes, and dendritic cells of B-hIFNAR1/hIFNAR2 mice but not in wild-type mice.
Analysis of Leukocyte Subpopulations
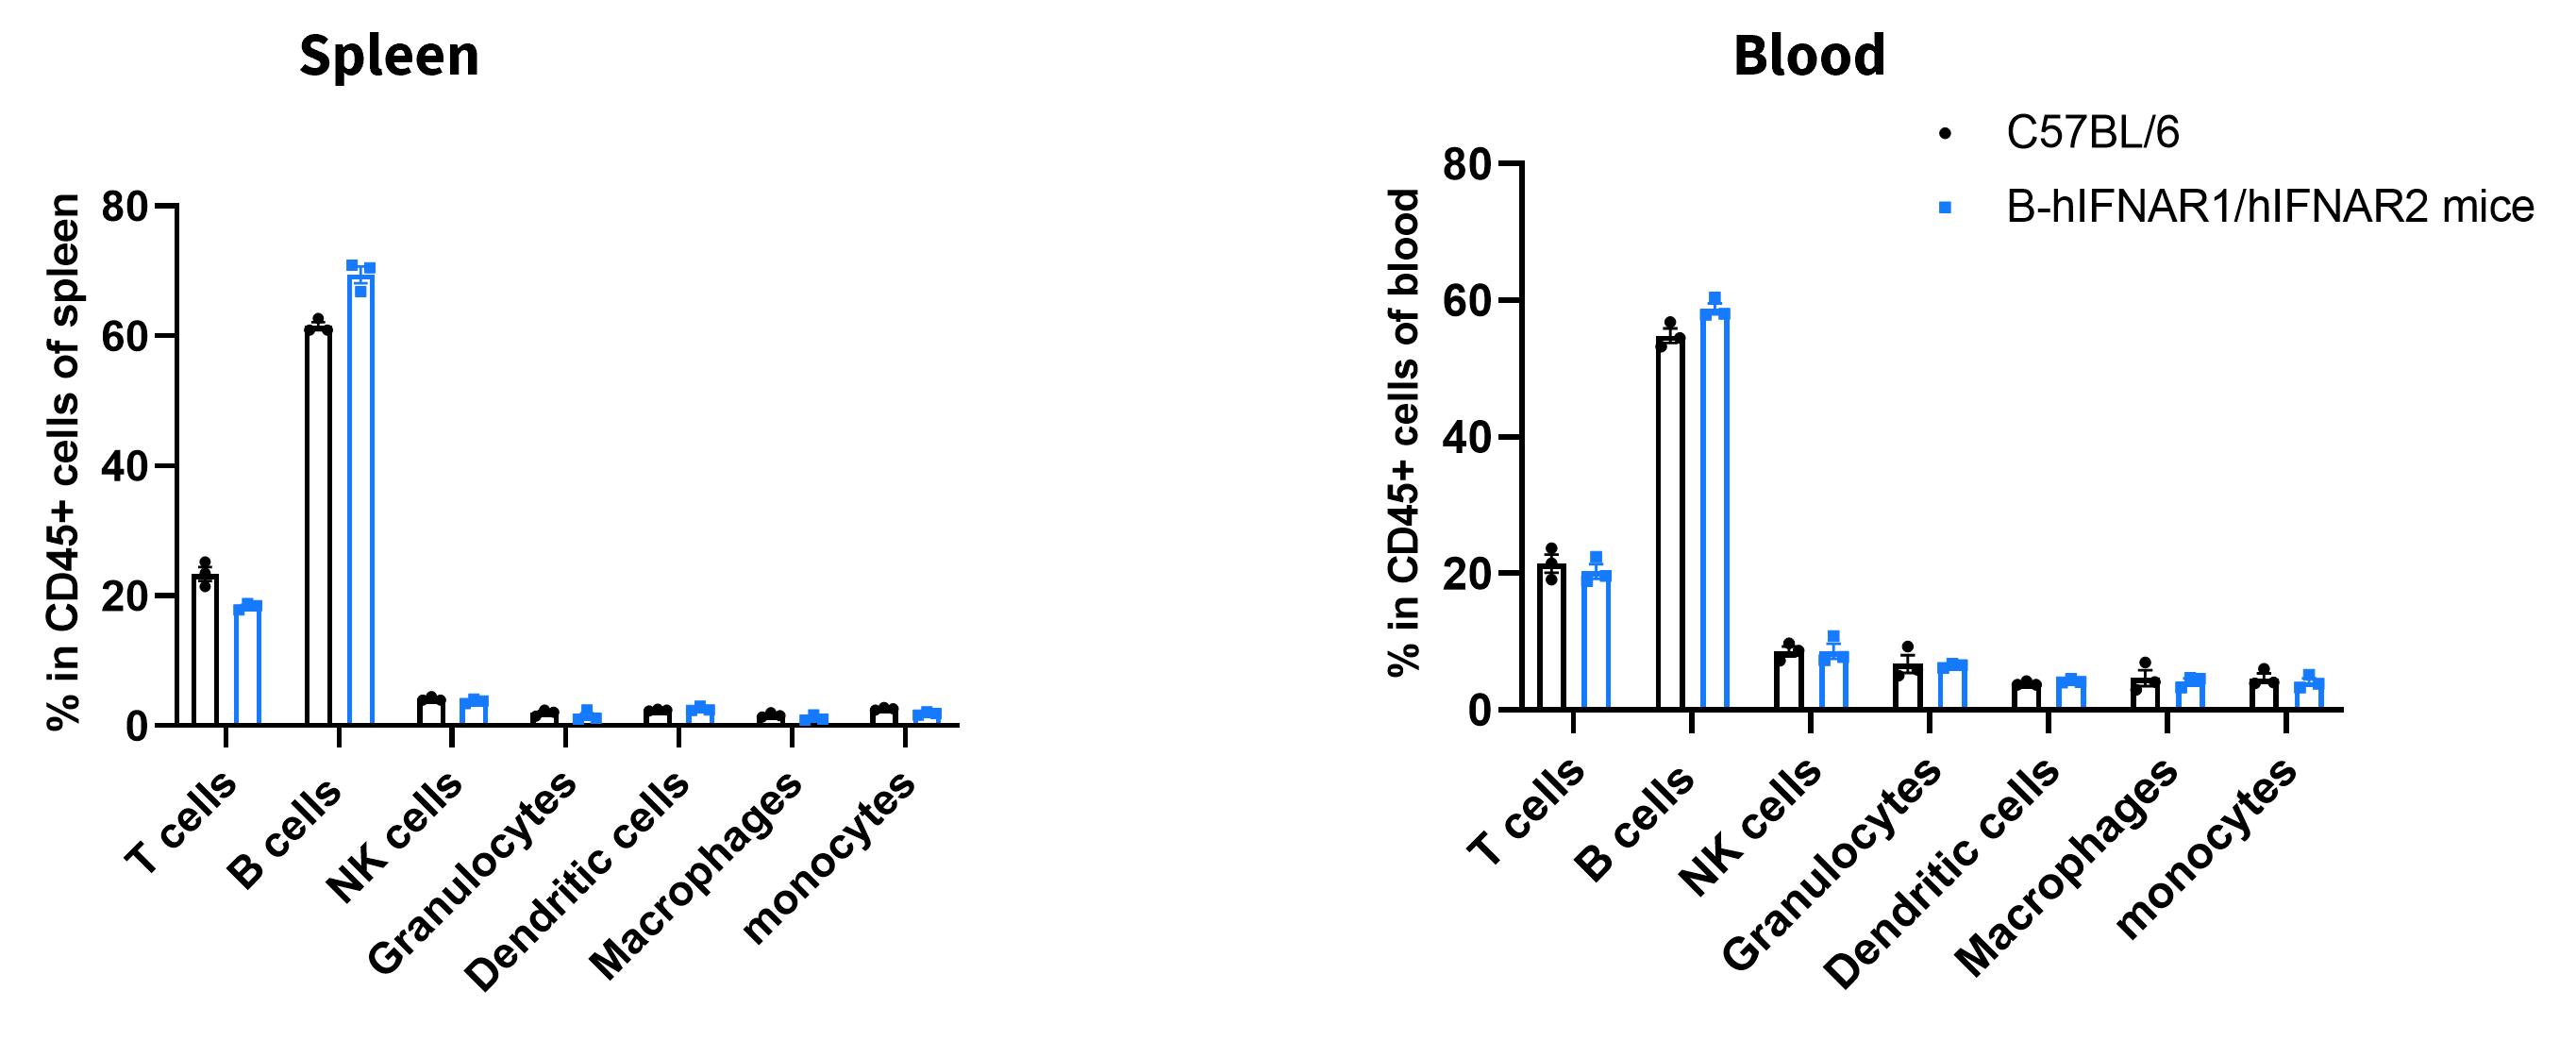
- The percentages of T cells, B cells, NK cells, DCs, neutrophils, monocytes, and macrophages in homozygous B-hIFNAR1/hIFNAR2 mice were similar to those in C57BL/6 mice.
- Humanization of IFNAR1 and IFNAR2 does not affect normal immune cell development or splenic distribution.
Analysis of leukocyte subpopulations by flow cytometry in spleen and blood. Splenocytes and peripheral blood were isolated from female C57BL/6 and B-hIFNAR1/hIFNAR2 mice (female, 9-week-old, n = 3). Single live cells were gated on the CD45⁺ population and analyzed by flow cytometry as indicated. Values are expressed as mean ± SEM.
Analysis of T Cell Subpopulations
- The proportions of CD4⁺ T cells, CD8⁺ T cells, and Tregs in homozygous B-hIFNAR1/hIFNAR2 mice were comparable to those in C57BL/6 mice.
- Humanization of IFNAR1 and IFNAR2 does not affect normal T cell development, differentiation, or splenic distribution.
Analysis of T-cell subpopulations by flow cytometry in spleen and blood. Splenocytes and peripheral blood were isolated from female C57BL/6 and B-hIFNAR1/hIFNAR2 mice (female, 9-week-old, n = 3). Single live cells were gated on the CD3⁺ T-cell population and analyzed by flow cytometry as indicated. Values are expressed as mean ± SEM.
Functional Validation
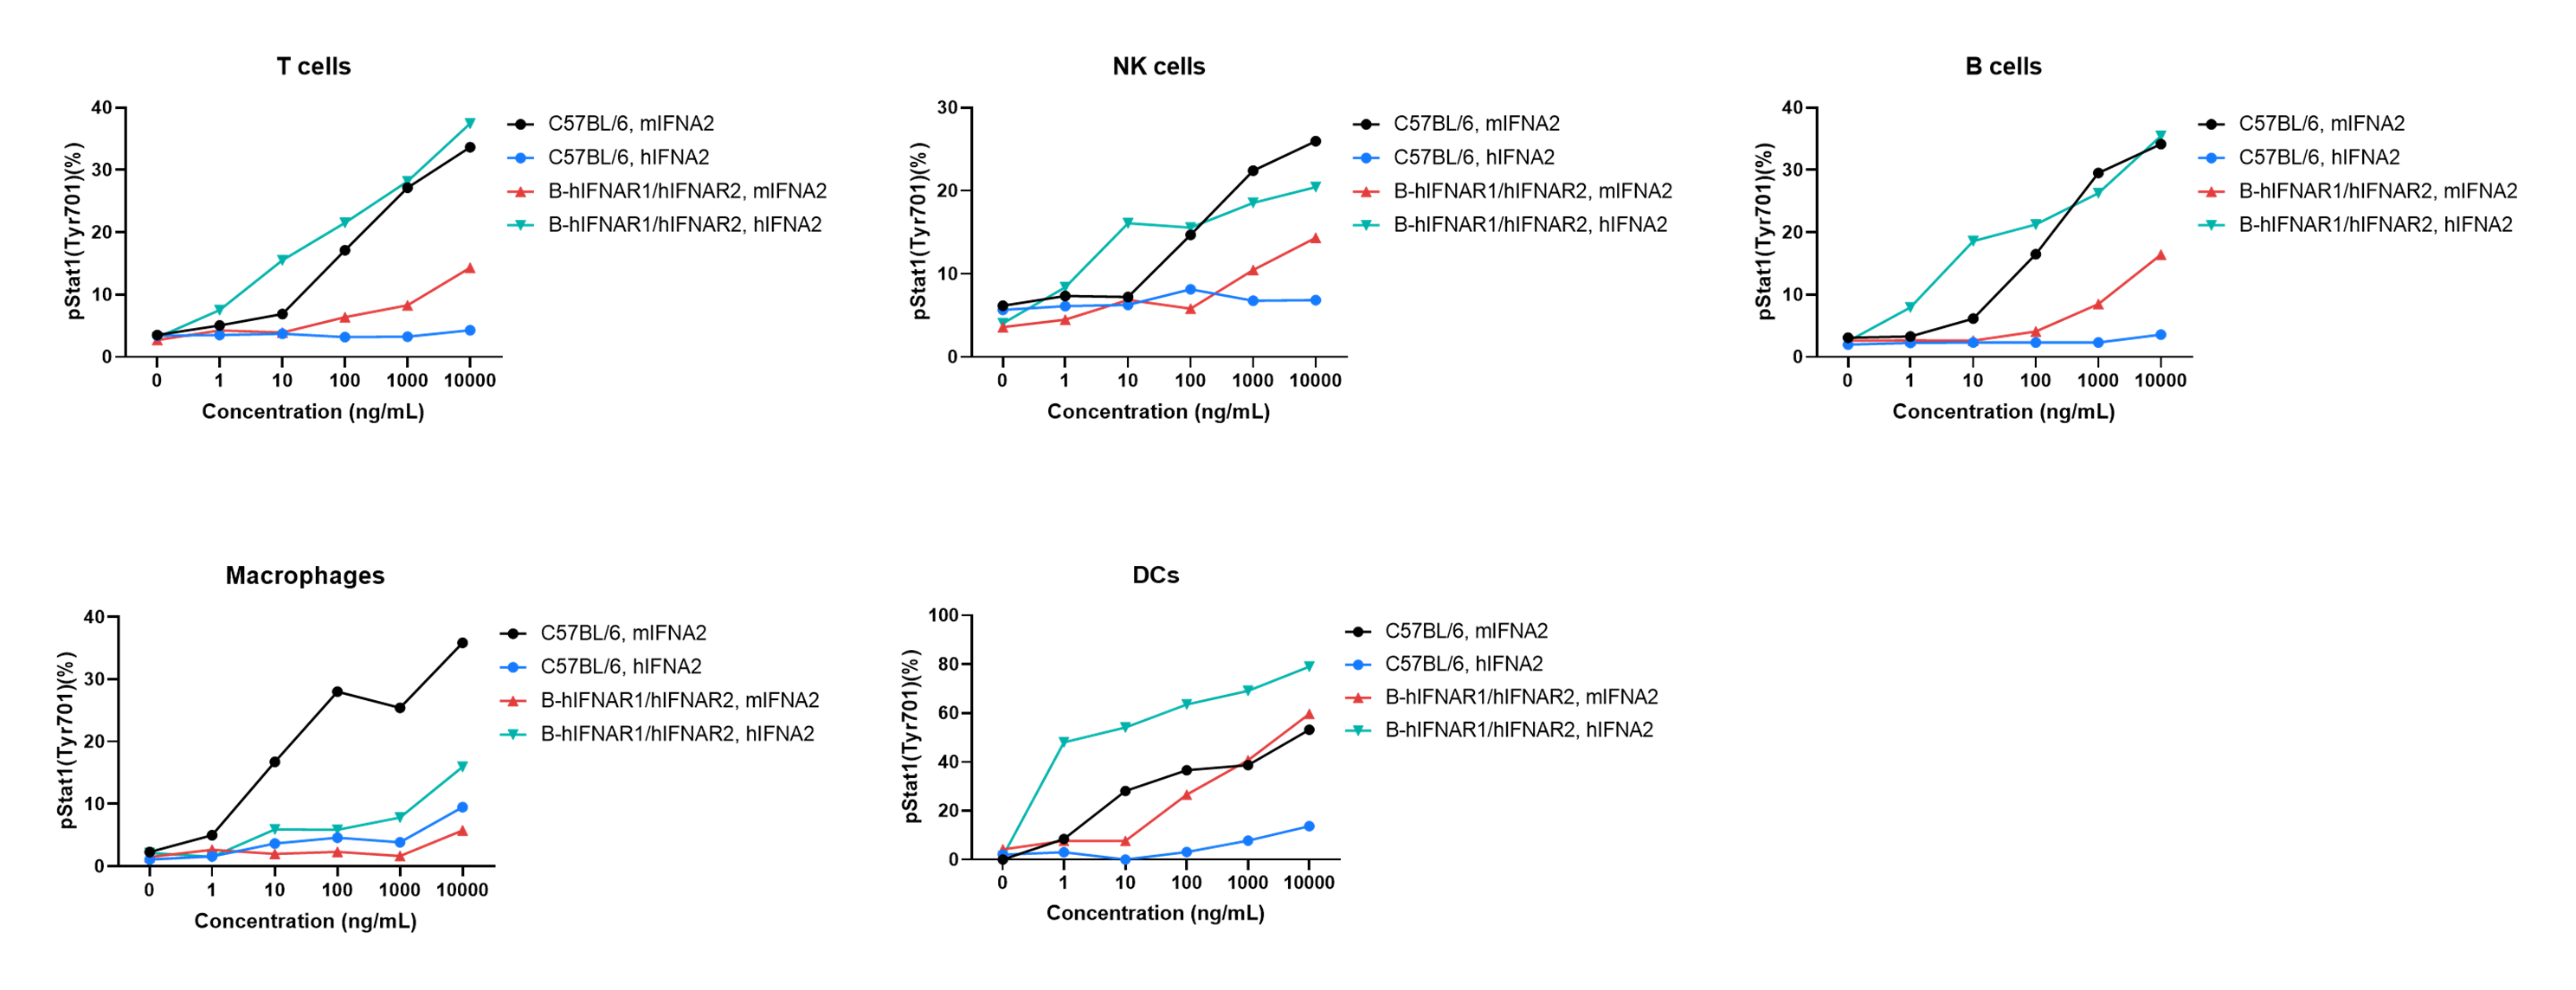
- Mouse IFNA2 induced the pStat1 expression in T cells, NK cells, B cells, macrophages, and DCs of wild-type mice in a dose-dependent manner.
- Human IFNA2 induced the pStat1 expression in T cells, NK cells, B cells, macrophages, and DCs of B-hIFNAR1/hIFNAR2 mice in a dose-dependent manner.
Analysis of the phosphorylation of stat1 in B-hIFNAR1/hIFNAR2 mice by flow cytometry. Splenocytes from wild-type C57BL/6 mice and homozygous B-hIFNAR1/hIFNAR2 mice were stimulated with mouse IFNA2 or human IFNA2 in vitro. Then FACS was performed to assay the phosphorylation of stat1. Mouse IFNA2 induced the pStat1 expression in wild-type mice in a dose-dependent manner. Human IFNA2 only induced the pStat1 expression in B-hIFNAR1/hIFNAR2 mice.
Human IFNA2 induced the pStat1 expression in T cells, NK cells, B cells, macrophages, monocytes, and neutrophils of B-hIFNAR1/hIFNAR2 mice.
Anti-human IFNAR1 antibody anifrolumab analog decreased the pStat1 expression level in T cells, NK cells, B cells, macrophages, monocytes, and neutrophils of B-hIFNAR1/hIFNAR2 mice in a dose-dependent manner.
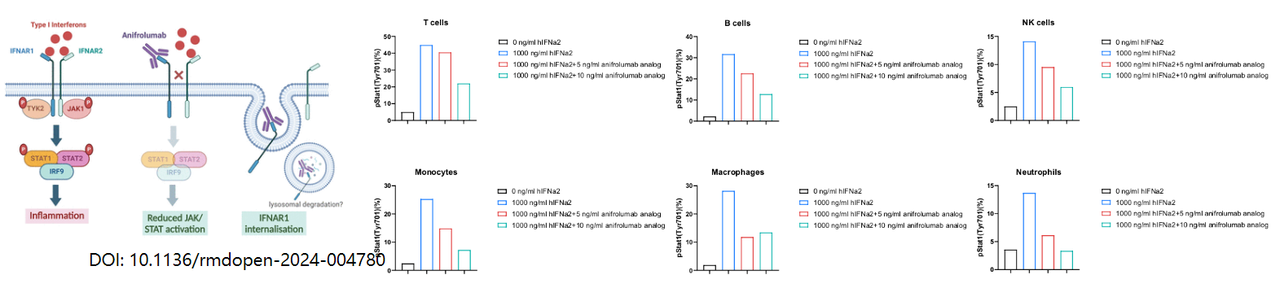
Analysis of the phosphorylation of stat1 in B-hIFNAR1/hIFNAR2 mice after anti-human IFNAR1 antibody anifrolumab analog treatment by flow cytometry. Splenocytes from homozygous B-hIFNAR1/hIFNAR2 mice were stimulated first with anti-human IFNAR1 antibody anifrolumab analog (in-house) then human IFNa2 in vitro. Then FACS was performed to assay the phosphorylation of stat1. Human IFNA2 induced the pStat1 expression in T cells, NK cells, B cells, macrophages, monocytes, and neutrophils of B-hIFNAR1/hIFNAR2 mice. Anti-human IFNAR1 antibody anifrolumab analog decreased the pStat1 expression in T cells, NK cells, B cells, macrophages, monocytes, and neutrophils of B-hIFNAR1/hIFNAR2 mice in a dose-dependent manner.
* When publishing results obtained using this animal model, please acknowledge the source as follows: The animal model [B-hIFNAR1/hIFNAR2 mice] (Cat# 112650) was purchased from Biocytogen.