

C57BL/6-Tractm1(TRAC)Bcgen Trbc1tm1(TRBC1)Bcgen Trbc2tm1(TRBC2)Bcgen/Bcgen • 113570

Targeting the TRAC/TRBC1/TRBC2: Biological Roles and Therapeutic Strategies

TRAC
TRBC1/TRBC2

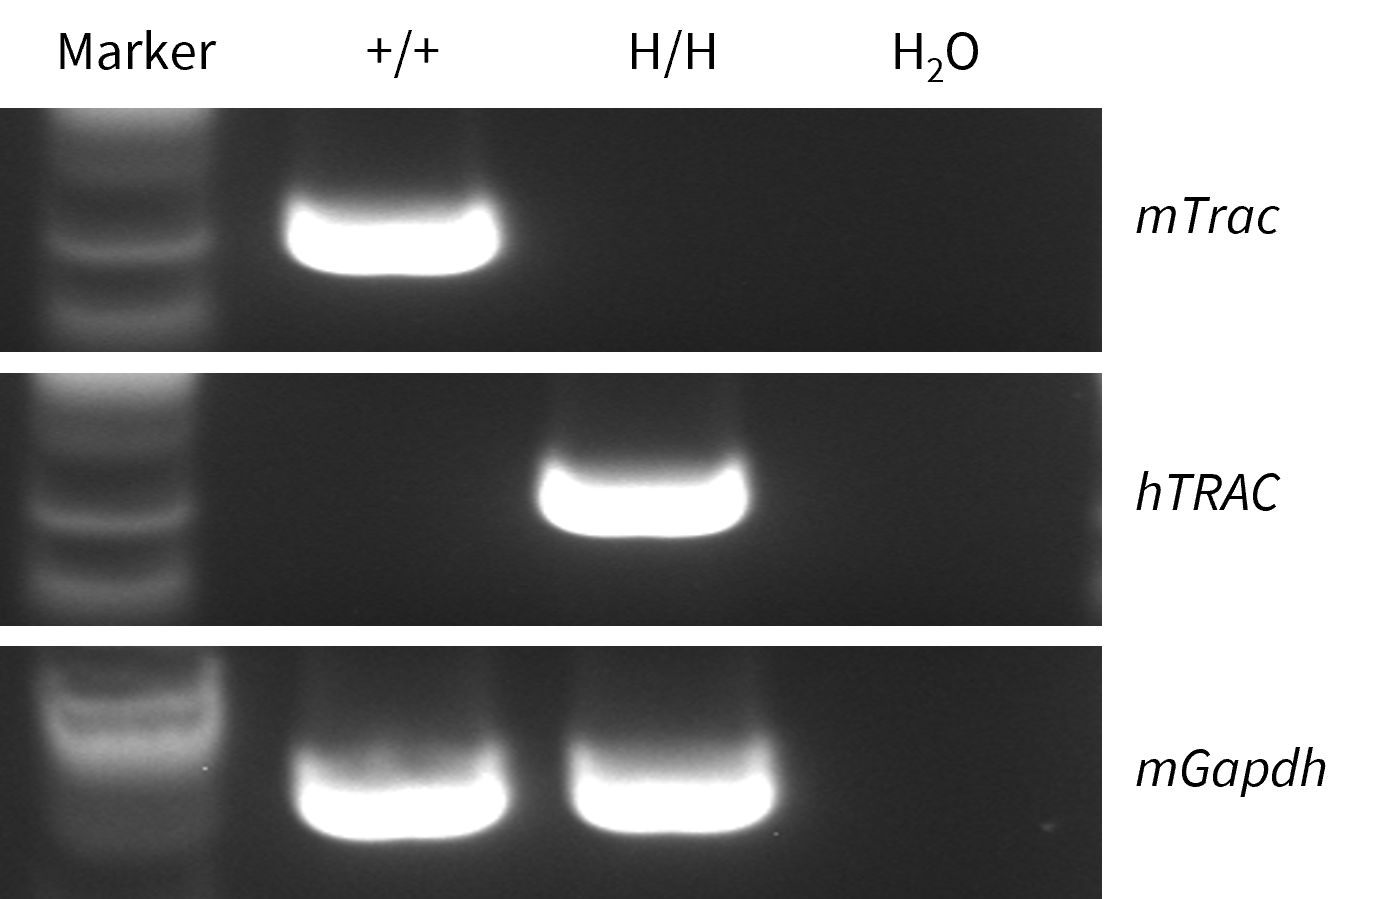
Strain specific analysis of TRAC gene expression in wild-type C57BL/6JNifdc mice and homozygous B-hTRAC/hTRBC1/hTRBC2 mice by RT-PCR. The splenocytes RNA was isolated from wild-type C57BL/6JNifdc mice (+/+) and homozygous B-hTRAC/hTRBC1/hTRBC2 mice (H/H), and then cDNA libraries were synthesized by reverse transcription, followed by PCR with mouse or human TRAC primers.
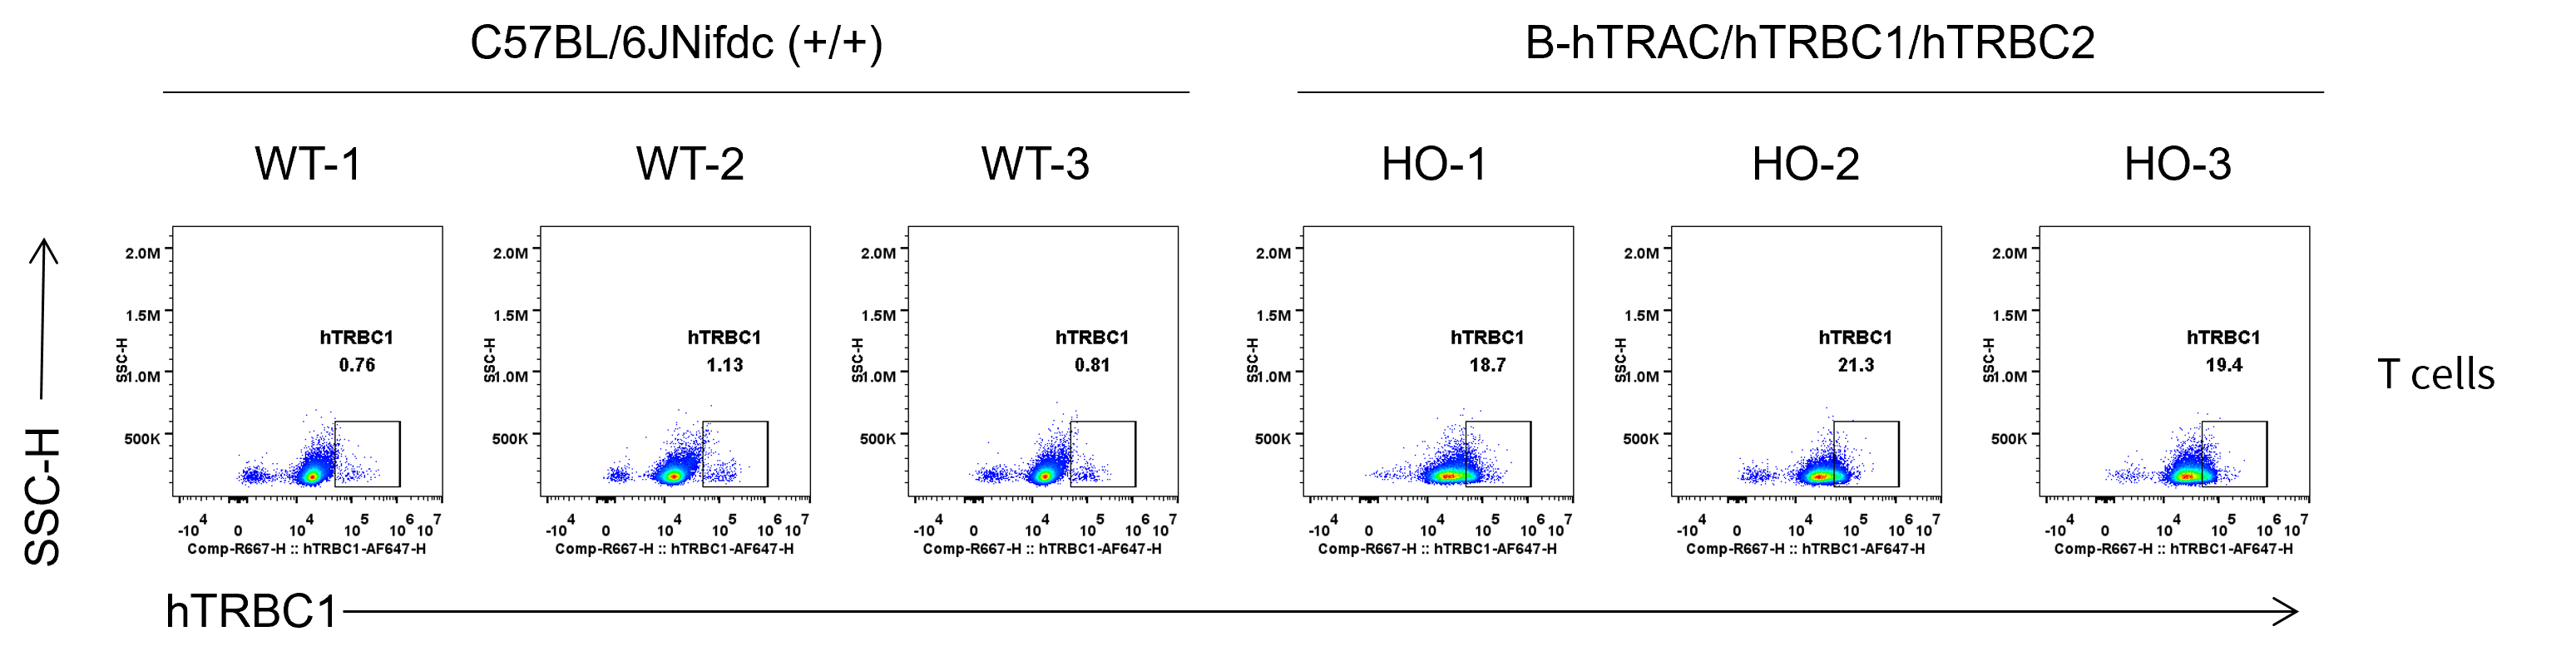
Strain specific TRBC1 expression analysis in wild-type C57BL/6JNifdc mice and homozygous B-hTRAC/hTRBC1/hTRBC2 mice by flow cytometry. Splenocytes were collected from wild-type C57BL/6JNifdc mice (+/+) and homozygous B-hTRAC/hTRBC1/hTRBC2 mice (H/H), and analyzed by flow cytometry with species-specific anti-human TRBC1 antibody (Biolegend, 383502).
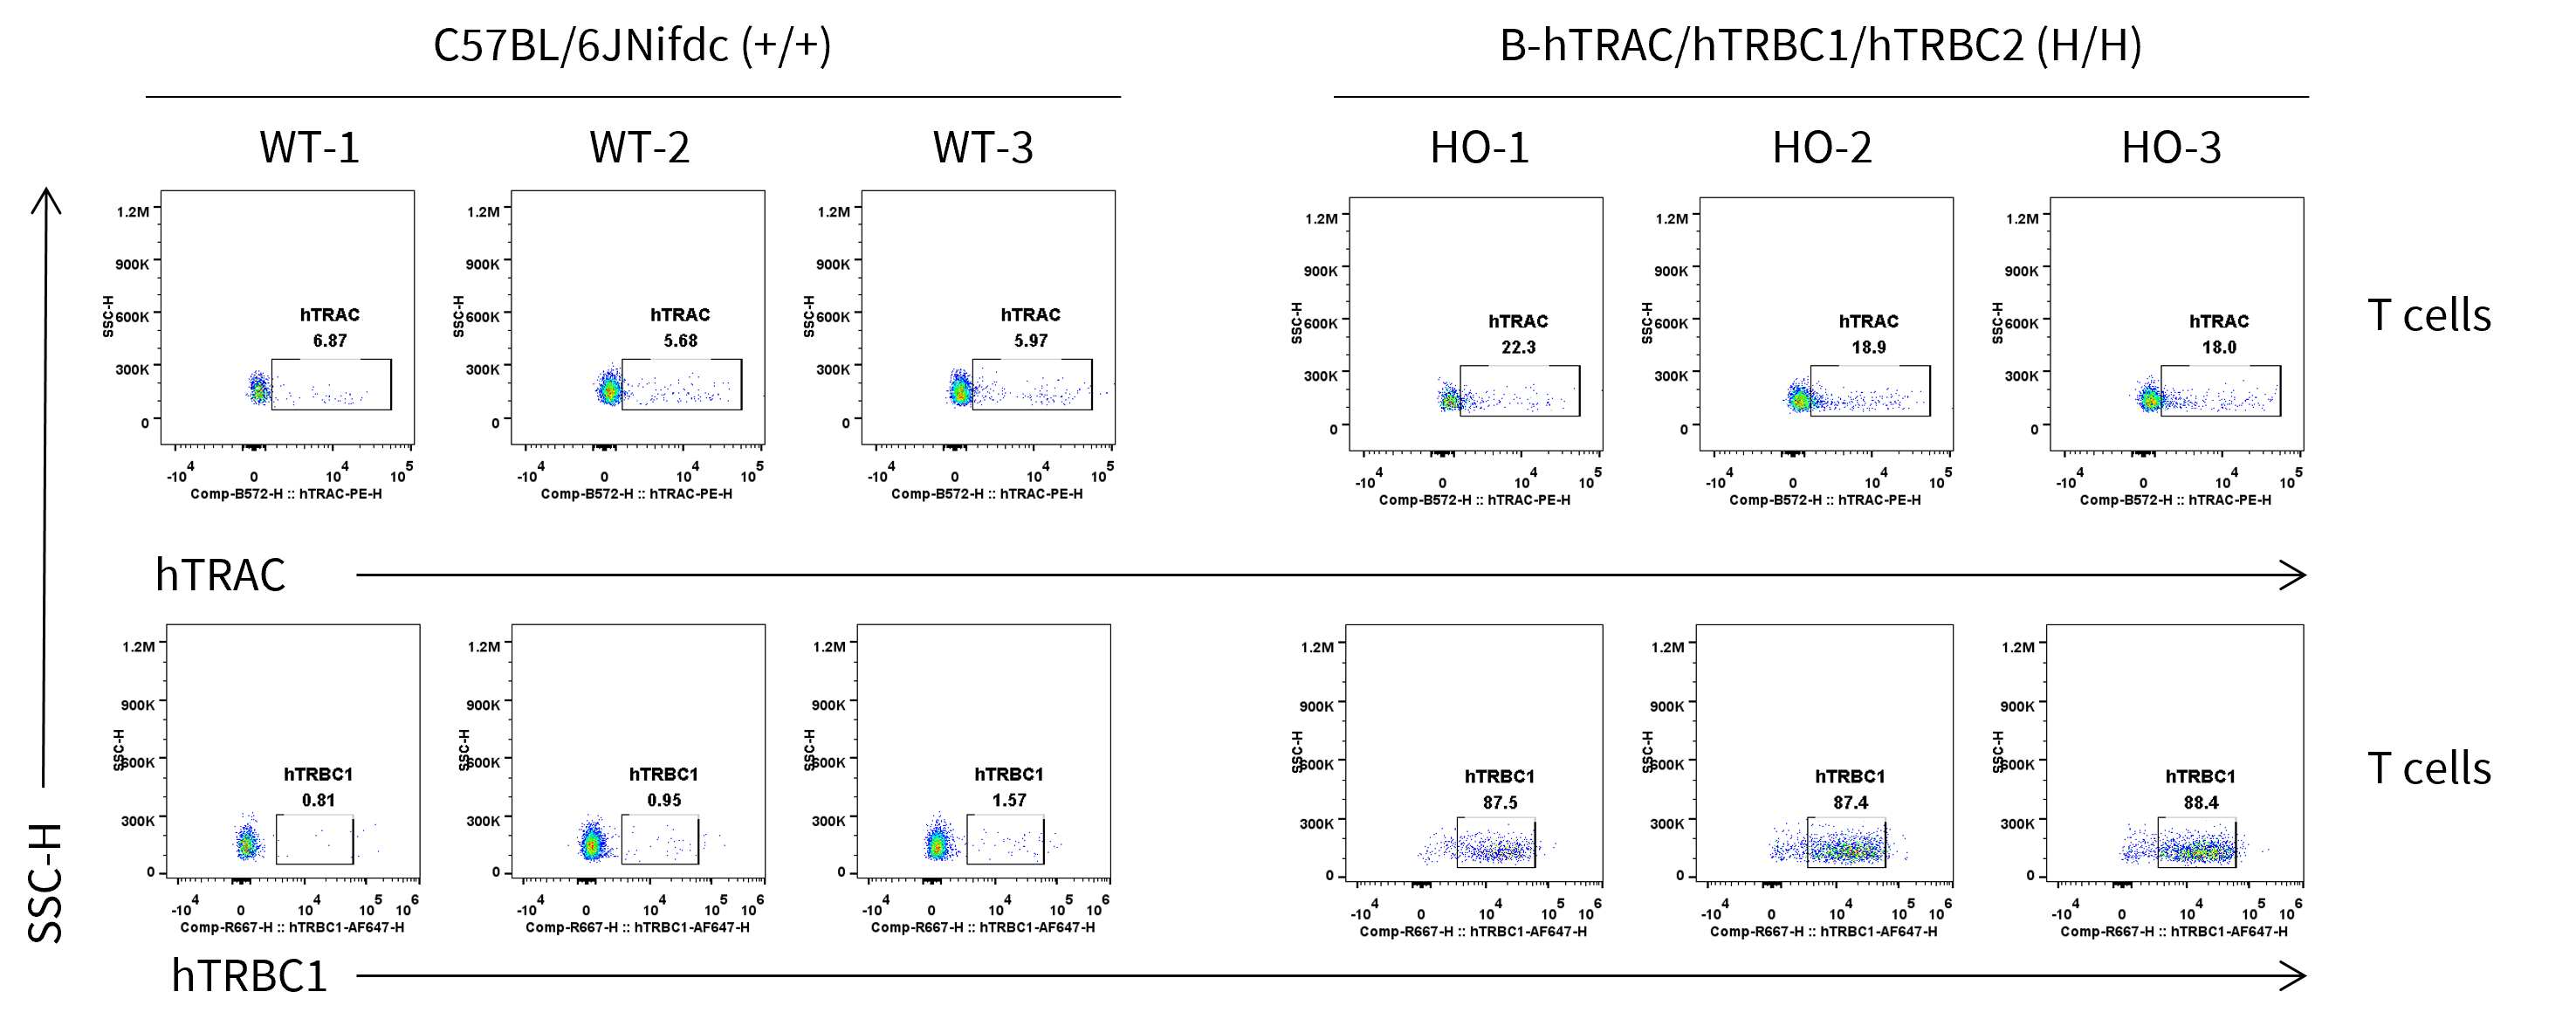
Strain specific TRAC and TRBC1 expression analysis in homozygous B-hTRAC/hTRBC1/hTRBC2 mice by flow cytometry. Blood cells were collected from wild-type C57BL/6JNifdc (+/+) and homozygous B-hTRAC/hTRBC1/hTRBC2 mice (H/H), and analyzed by flow cytometry with species-specific anti-human TRAC antibody (Invitrogen, PA5-95587) and anti-human TRBC1 antibody (Biolegend, 383502).

Analysis of leukocyte subpopulations by flow cytometry in immune organs and blood. Splenocytes, peripheral blood, and lymph nodes were isolated from female C57BL/6JNifdc mice and B-hTRAC/hTRBC1/hTRBC2 mice (male, 8-week-old, n = 3). Single live cells were gated on the CD3⁺ T-cell population and analyzed by flow cytometry as indicated. Values are expressed as mean ± SEM.

Analysis of T-cell subpopulations by flow cytometry in immune organs and blood. Splenocytes, peripheral blood, and lymph nodes were isolated from female C57BL/6JNifdc and B-hTRAC/hTRBC1/hTRBC2 Mice (male, 8-week-old, n=3). Single live cells were gated on the CD3⁺ T-cell population and analyzed by flow cytometry as indicated. Values are expressed as mean ± SEM.
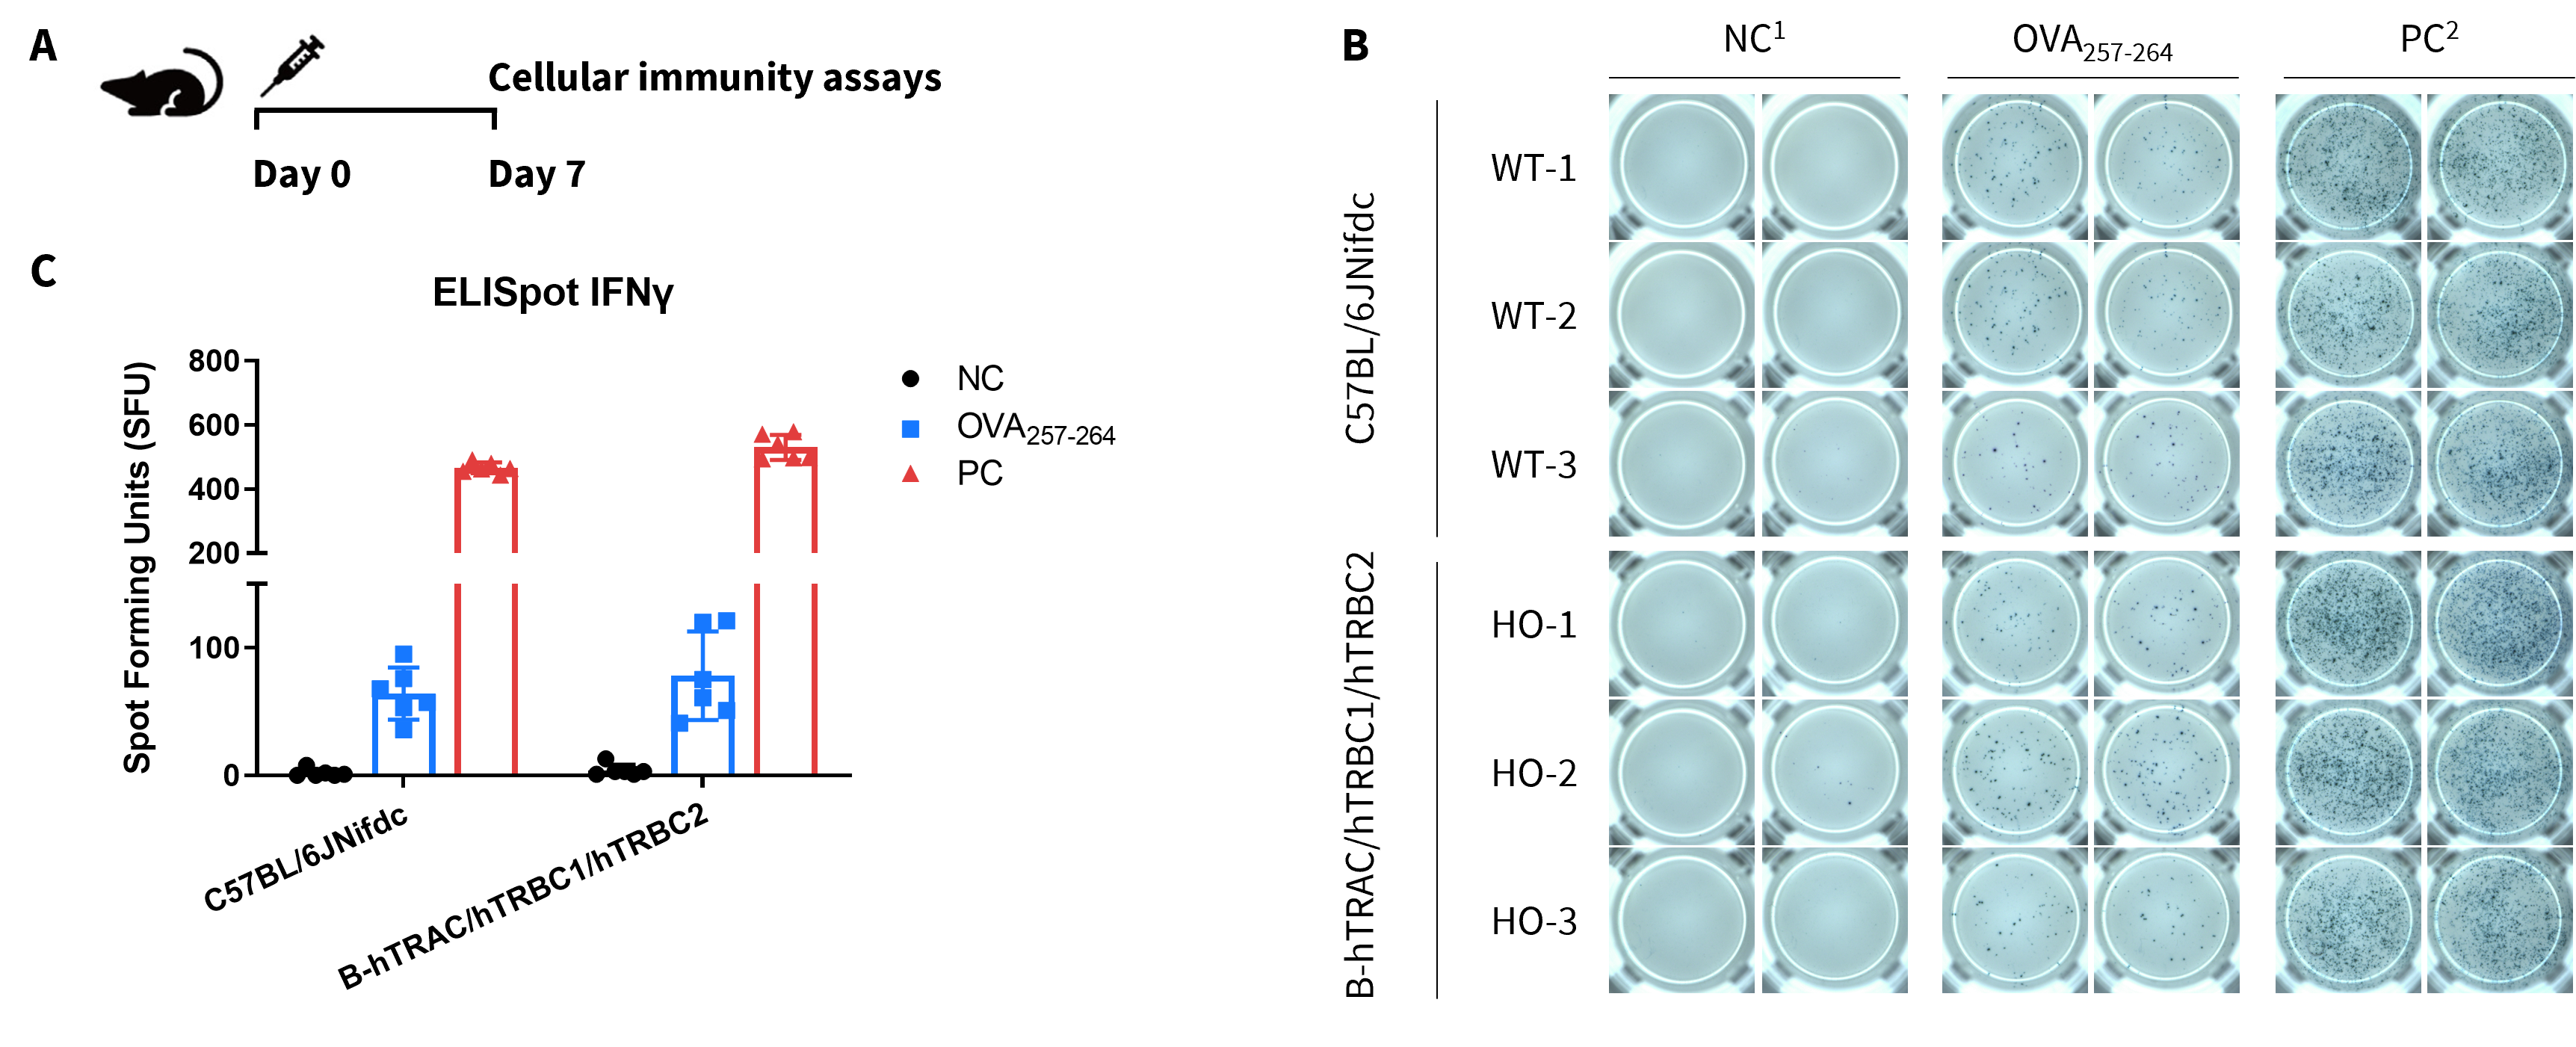
Detection of OVA-induced immune responses in B-hTRAC/hTRBC1/hTRBC2 mice by IFN-γ ELISpot assay. (A) Scheme of OVA immunization and testing. Female C57BL/6JNifdc (WT) and B-hTRAC/hTRBC1/hTRBC2 mice (9–10-week-old) received a single i.p. injection of 0.5 mg OVA protein + 50 μg poly(I:C). One week post-immunization, splenocytes were harvested and stimulated in vitro with negative control (1: NC/no peptide), OVA peptide257–264, or positive control (2: PC/Cell Activation Cocktail, (Biolegend, 42330) ) to measure IFN-γ secretion. (B) Representative results showing stimulation of splenocytes harvested from immunized mice with negative control, or OVA peptide257–264, or positive control in duplicates. (C) ELISpot Quantification: Statistical summary of IFN-γ-secreting cells.
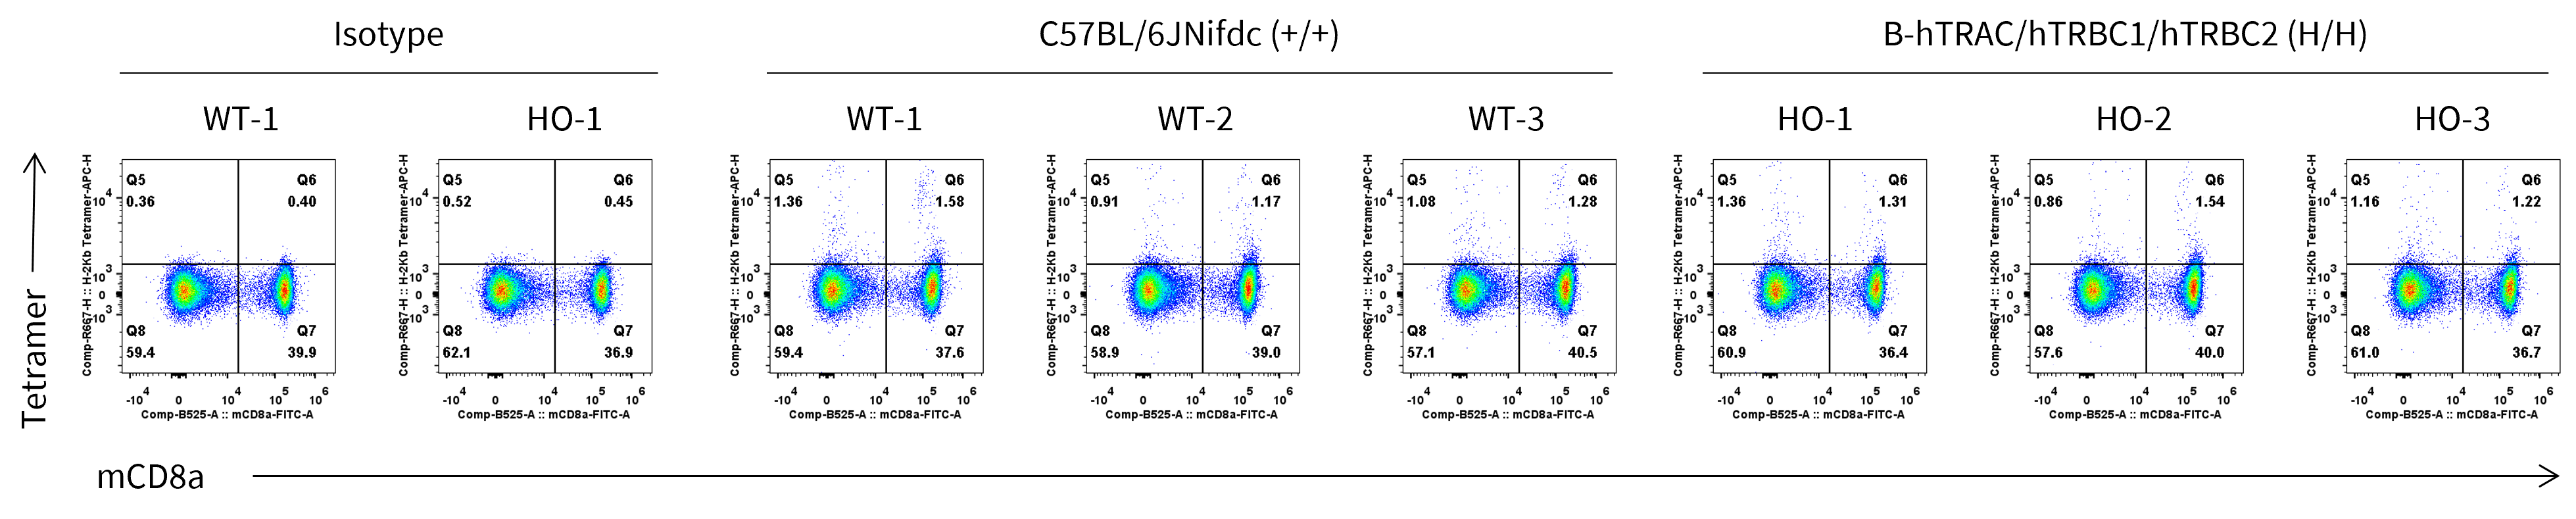
Frequency of OVA-specific T cells among spleen cells was assessed by flow cytometric analysis of SIINFEKL-MHC-I tetramer+ CD8+ T cells. Wild-type C57BL/6JNifdc mice and homozygous B-hTRAC/hTRBC1/hTRBC2 mice (Female, 9–10-week-old, n = 3) were immunized with intraperitoneal injection of 0.5 mg of OVA protein (Simga, A5503-25MG) and 50 μg poly (I:C) (InvivoGen, tlrl-pic). Mice were immunized with OVA one time. One week after the immunization, mice were sacrificed and spleen cells stained with Tetramers(MBL, TS-5001-2C). OVA-specific T cells were detected. The value on the upper right of each plot indicates the percentage of Tetramer-positive CD8+ T cells.
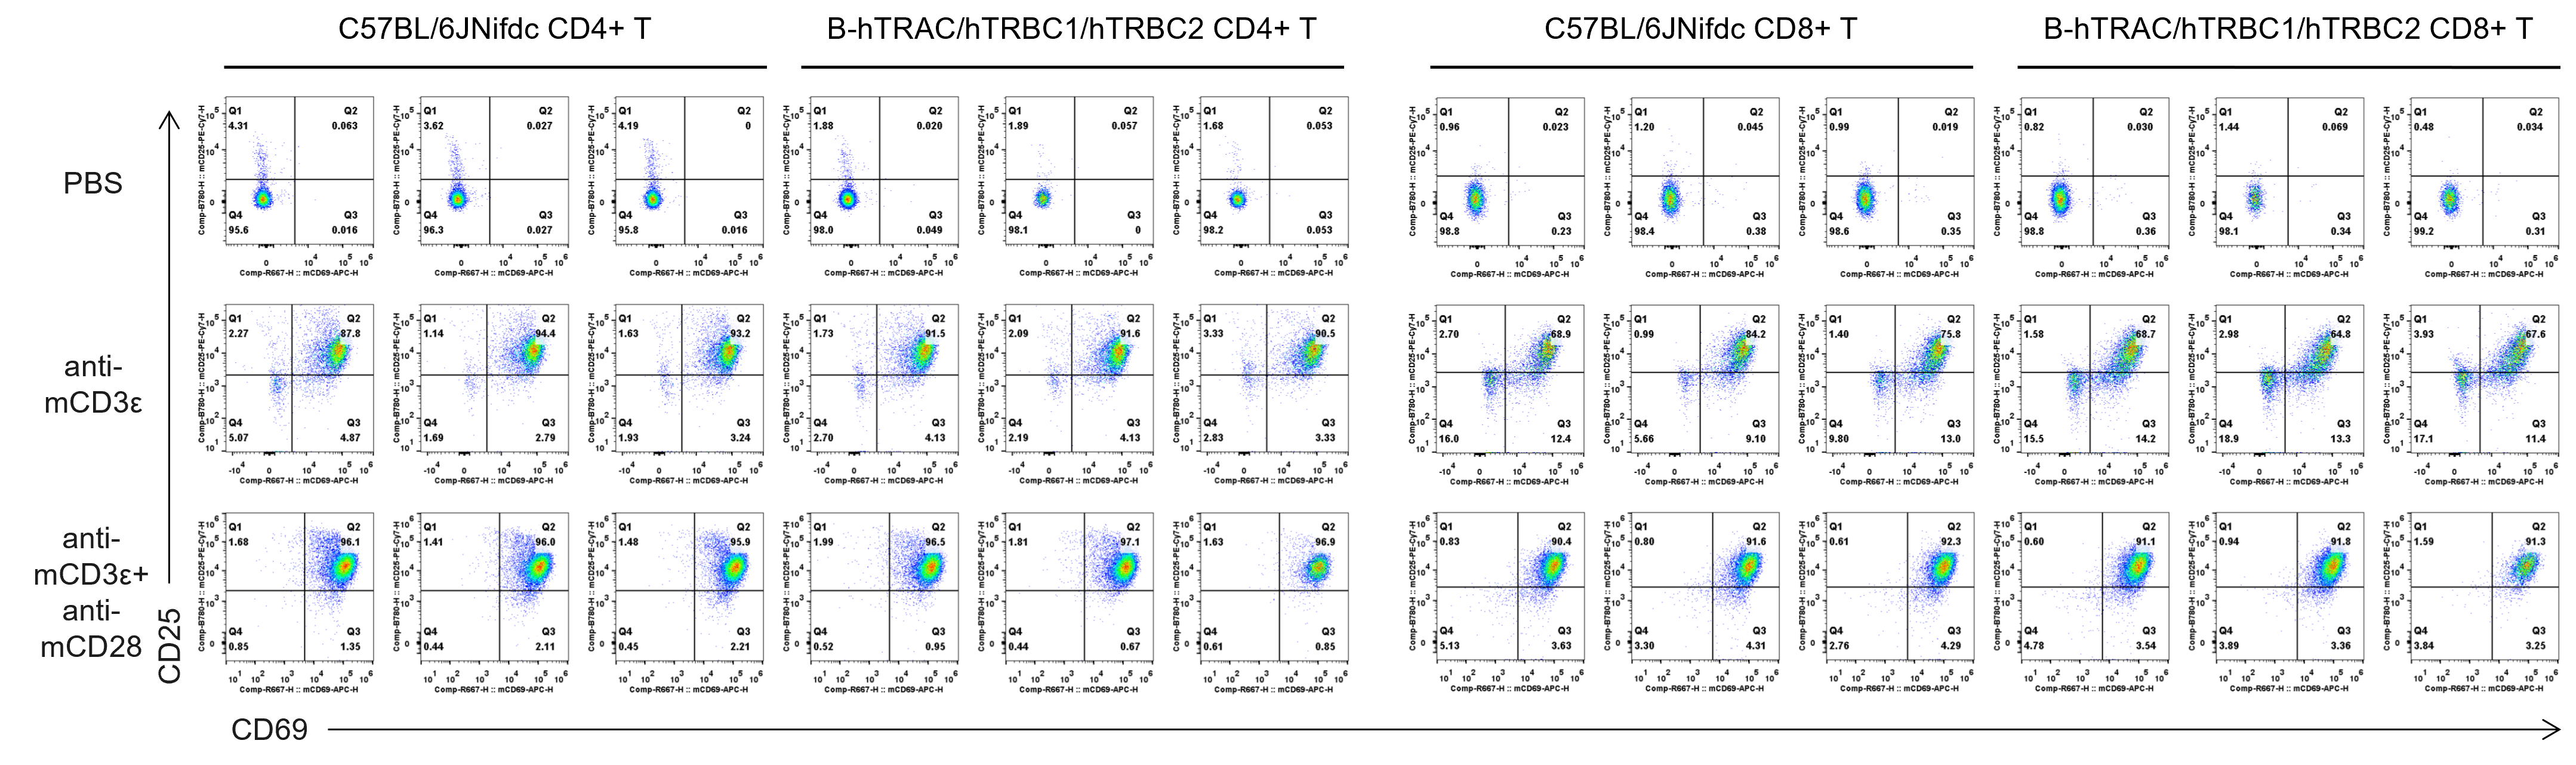
In vitro T cell activation by anti-mCD3ε antibody with or without anti-mCD28 antibody in wild-type C57BL/6JNifdc mice and homozygous humanized B-hTRAC/hTRBC1/hTRBC2 mice (24h). T cells were isolated from splenocytes of C57BL/6JNifdc and B-hTRAC/hTRBC1/hTRBC2 mice (female, 13-week-old, n = 3), and incubated in the presence of anti-mCD3ε antibody (2 ug/ml, BioXcell, BE0001-2), with or witnout anti-mCD28 antibody (5 ug/ml, BioXcell, BE0015-1) for 24h.
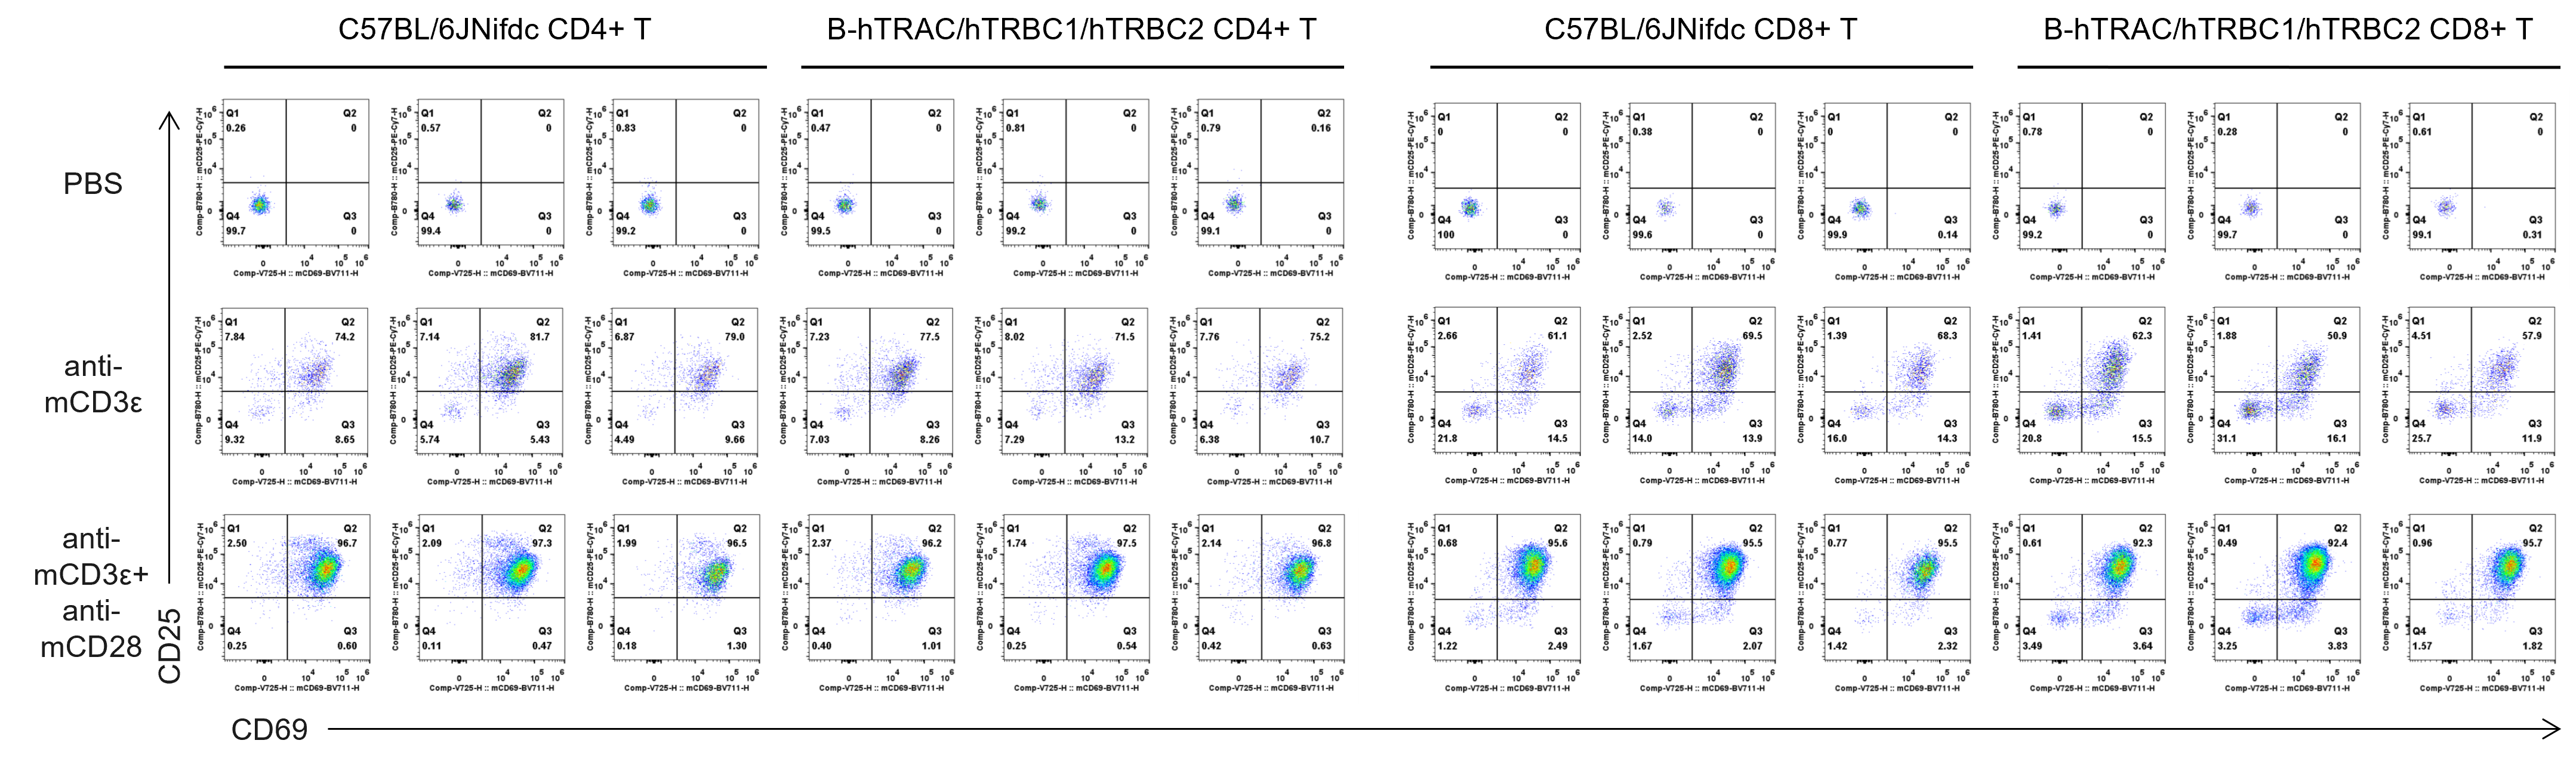
In vitro T cell activation by anti-mCD3ε antibody with or without anti-mCD28 antibody in wild-type C57BL/6JNifdc mice and homozygous humanized B-hTRAC/hTRBC1/hTRBC2 mice (48h). T cells were isolated from splenocytes of C57BL/6JNifdc and B-hTRAC/hTRBC1/hTRBC2 mice (female, 13-week-old, n = 3), and incubated in the presence of anti-mCD3ε antibody (2 ug/ml, BioXcell, BE0001-2), with or witnout anti-mCD28 antibody (5 ug/ml, BioXcell, BE0015-1) for 48h.
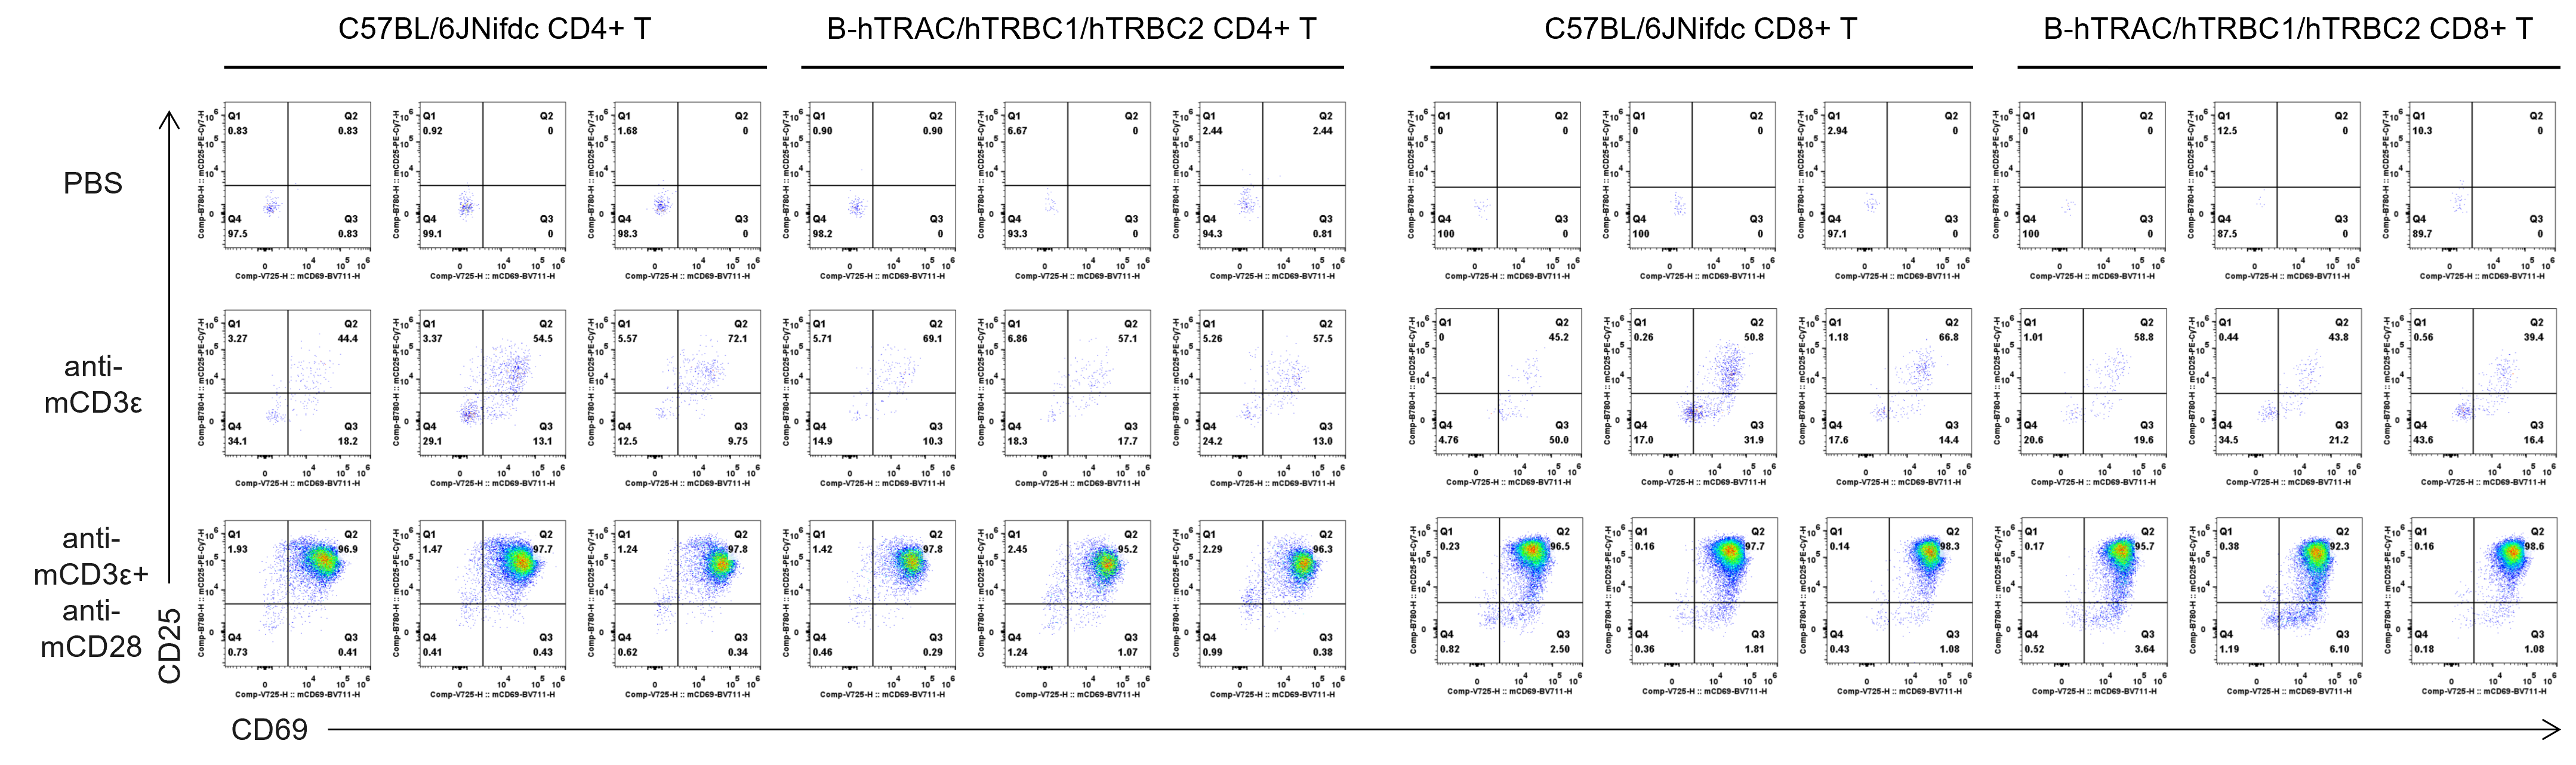
In vitro T cell activation by anti-mCD3ε antibody with or without anti-mCD28 antibody in wild-type C57BL/6JNifdc mice and homozygous humanized B-hTRAC/hTRBC1/hTRBC2 mice (72h). T cells were isolated from splenocytes of C57BL/6JNifdc and B-hTRAC/hTRBC1/hTRBC2 mice (female, 13-week-old, n = 3), and incubated in the presence of anti-mCD3ε antibody (2 ug/ml, BioXcell, BE0001-2), with or witnout anti-mCD28 antibody (5 ug/ml, BioXcell, BE0015-1) for 72h.
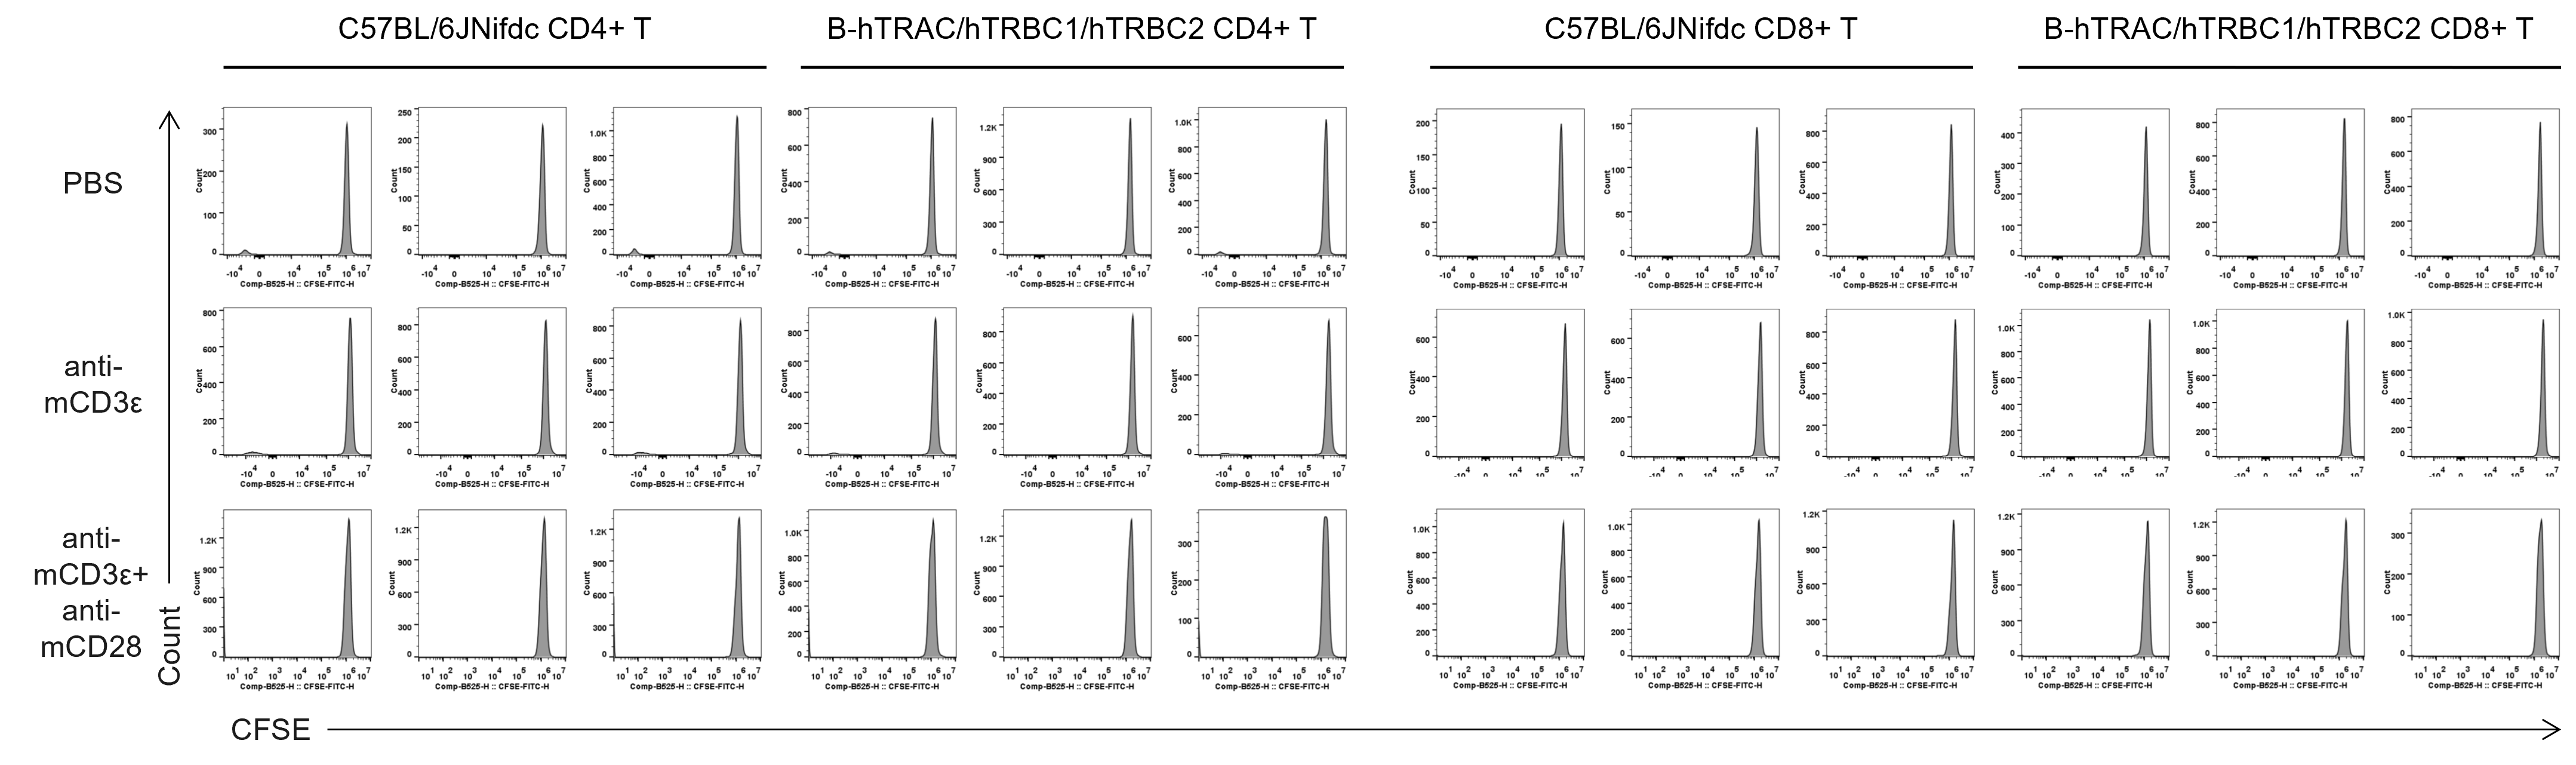
Quantification of T cell proliferation in vitro by anti-CD3ε antibody with or without anti-mCD28 antibody in wild-type C57BL/6JNifdc mice and homozygous humanized B-hTRAC/hTRBC1/hTRBC2 mice (24h). T cells were isolated from splenocytes of C57BL/6JNifdc and B-hTRAC/hTRBC1/hTRBC2 mice (female,13-week-old, n = 3), and incubated in the presence of anti-mCD3ε antibody (2 ug/ml, BioXcell, BE0001-2), with or witnout anti-mCD28 antibody (5 ug/ml, BioXcell, BE0015-1) for 24h.
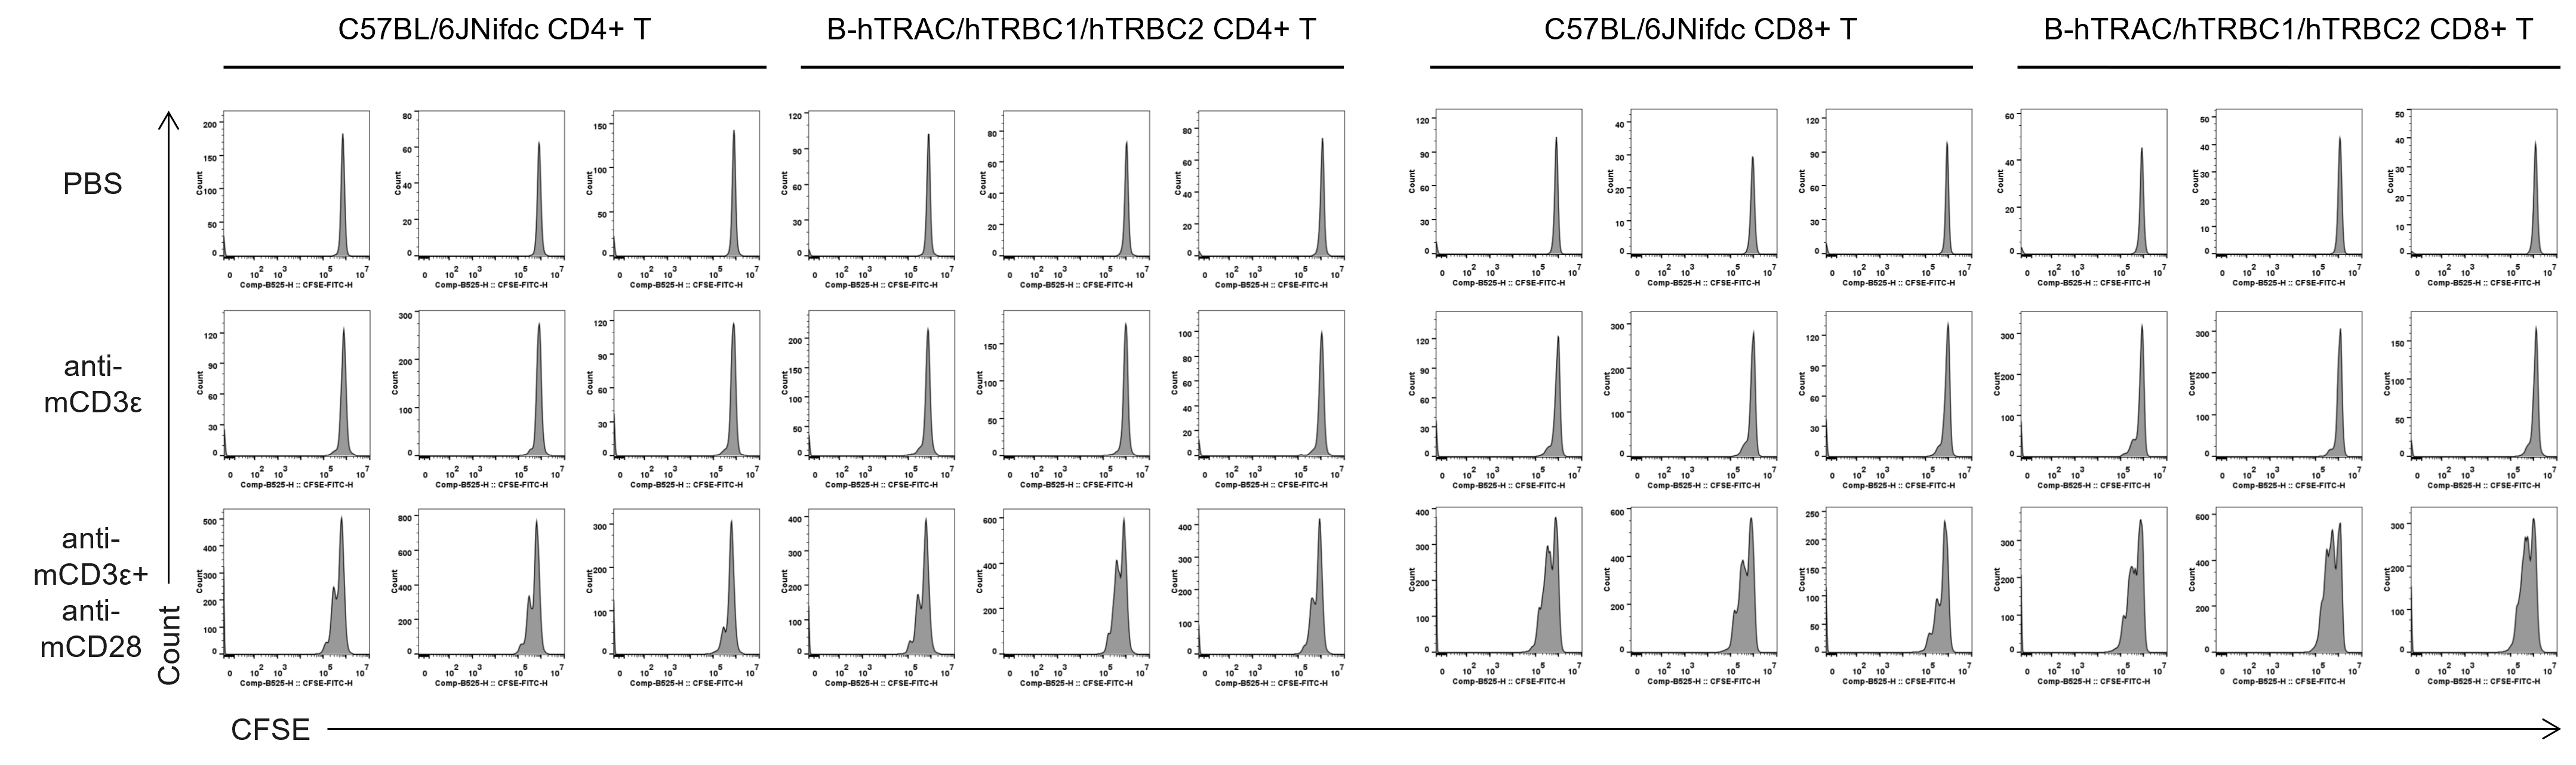
Quantification of T cell proliferation in vitro by anti-CD3ε antibody with or without anti-mCD28 antibody in wild-type C57BL/6JNifdc mice and homozygous humanized B-hTRAC/hTRBC1/hTRBC2 mice (48h). T cells were isolated from splenocytes of C57BL/6JNifdc and B-hTRAC/hTRBC1/hTRBC2 mice (female,13-week-old, n = 3), and incubated in the presence of anti-mCD3ε antibody (2 ug/ml, BioXcell, BE0001-2), with or witnout anti-mCD28 antibody (5 ug/ml, BioXcell, BE0015-1) for 48h.
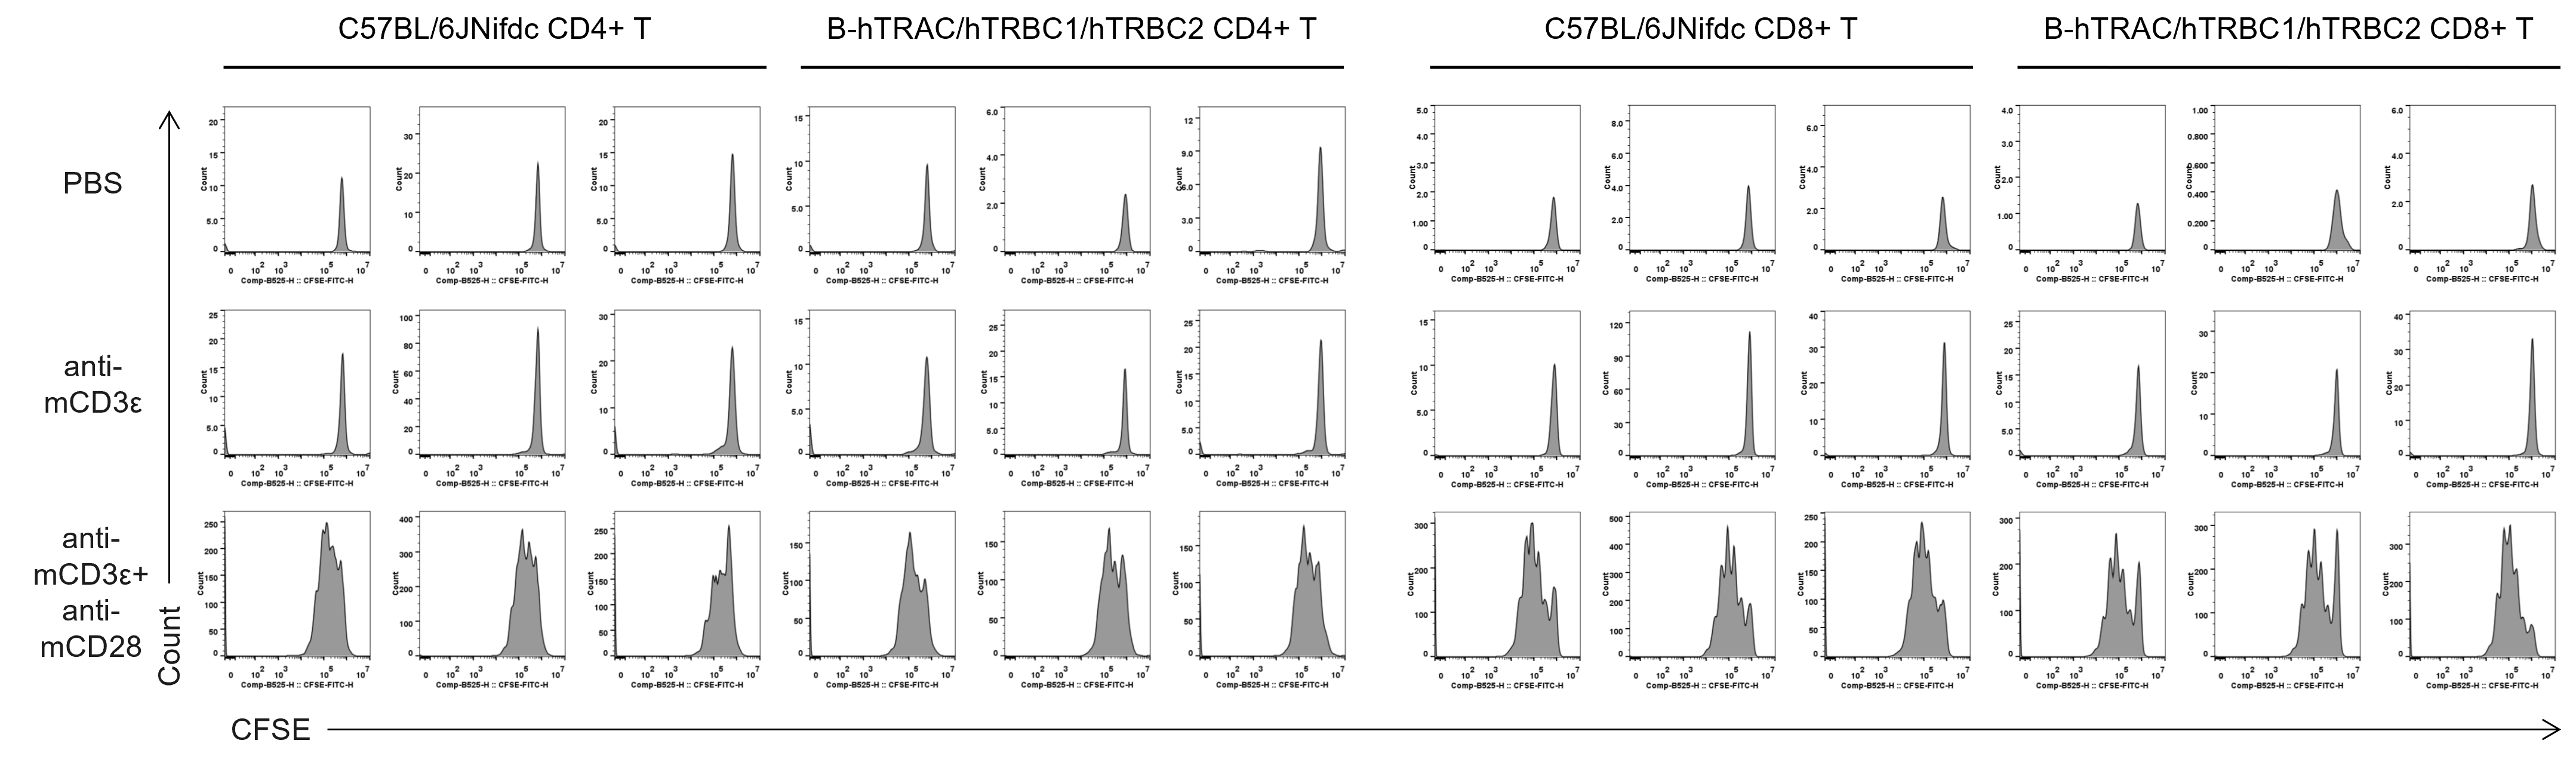
Quantification of T cell proliferation in vitro by anti-CD3ε antibody with or without anti-mCD28 antibody in wild-type C57BL/6JNifdc mice and homozygous humanized B-hTRAC/hTRBC1/hTRBC2 mice (72h). T cells were isolated from splenocytes of C57BL/6JNifdc and B-hTRAC/hTRBC1/hTRBC2 mice (female, 13-week-old, n = 3), and incubated in the presence of anti-mCD3ε antibody (2 ug/ml, BioXcell, BE0001-2), with or witnout anti-mCD28 antibody (5 ug/ml, BioXcell, BE0015-1) for 72h.
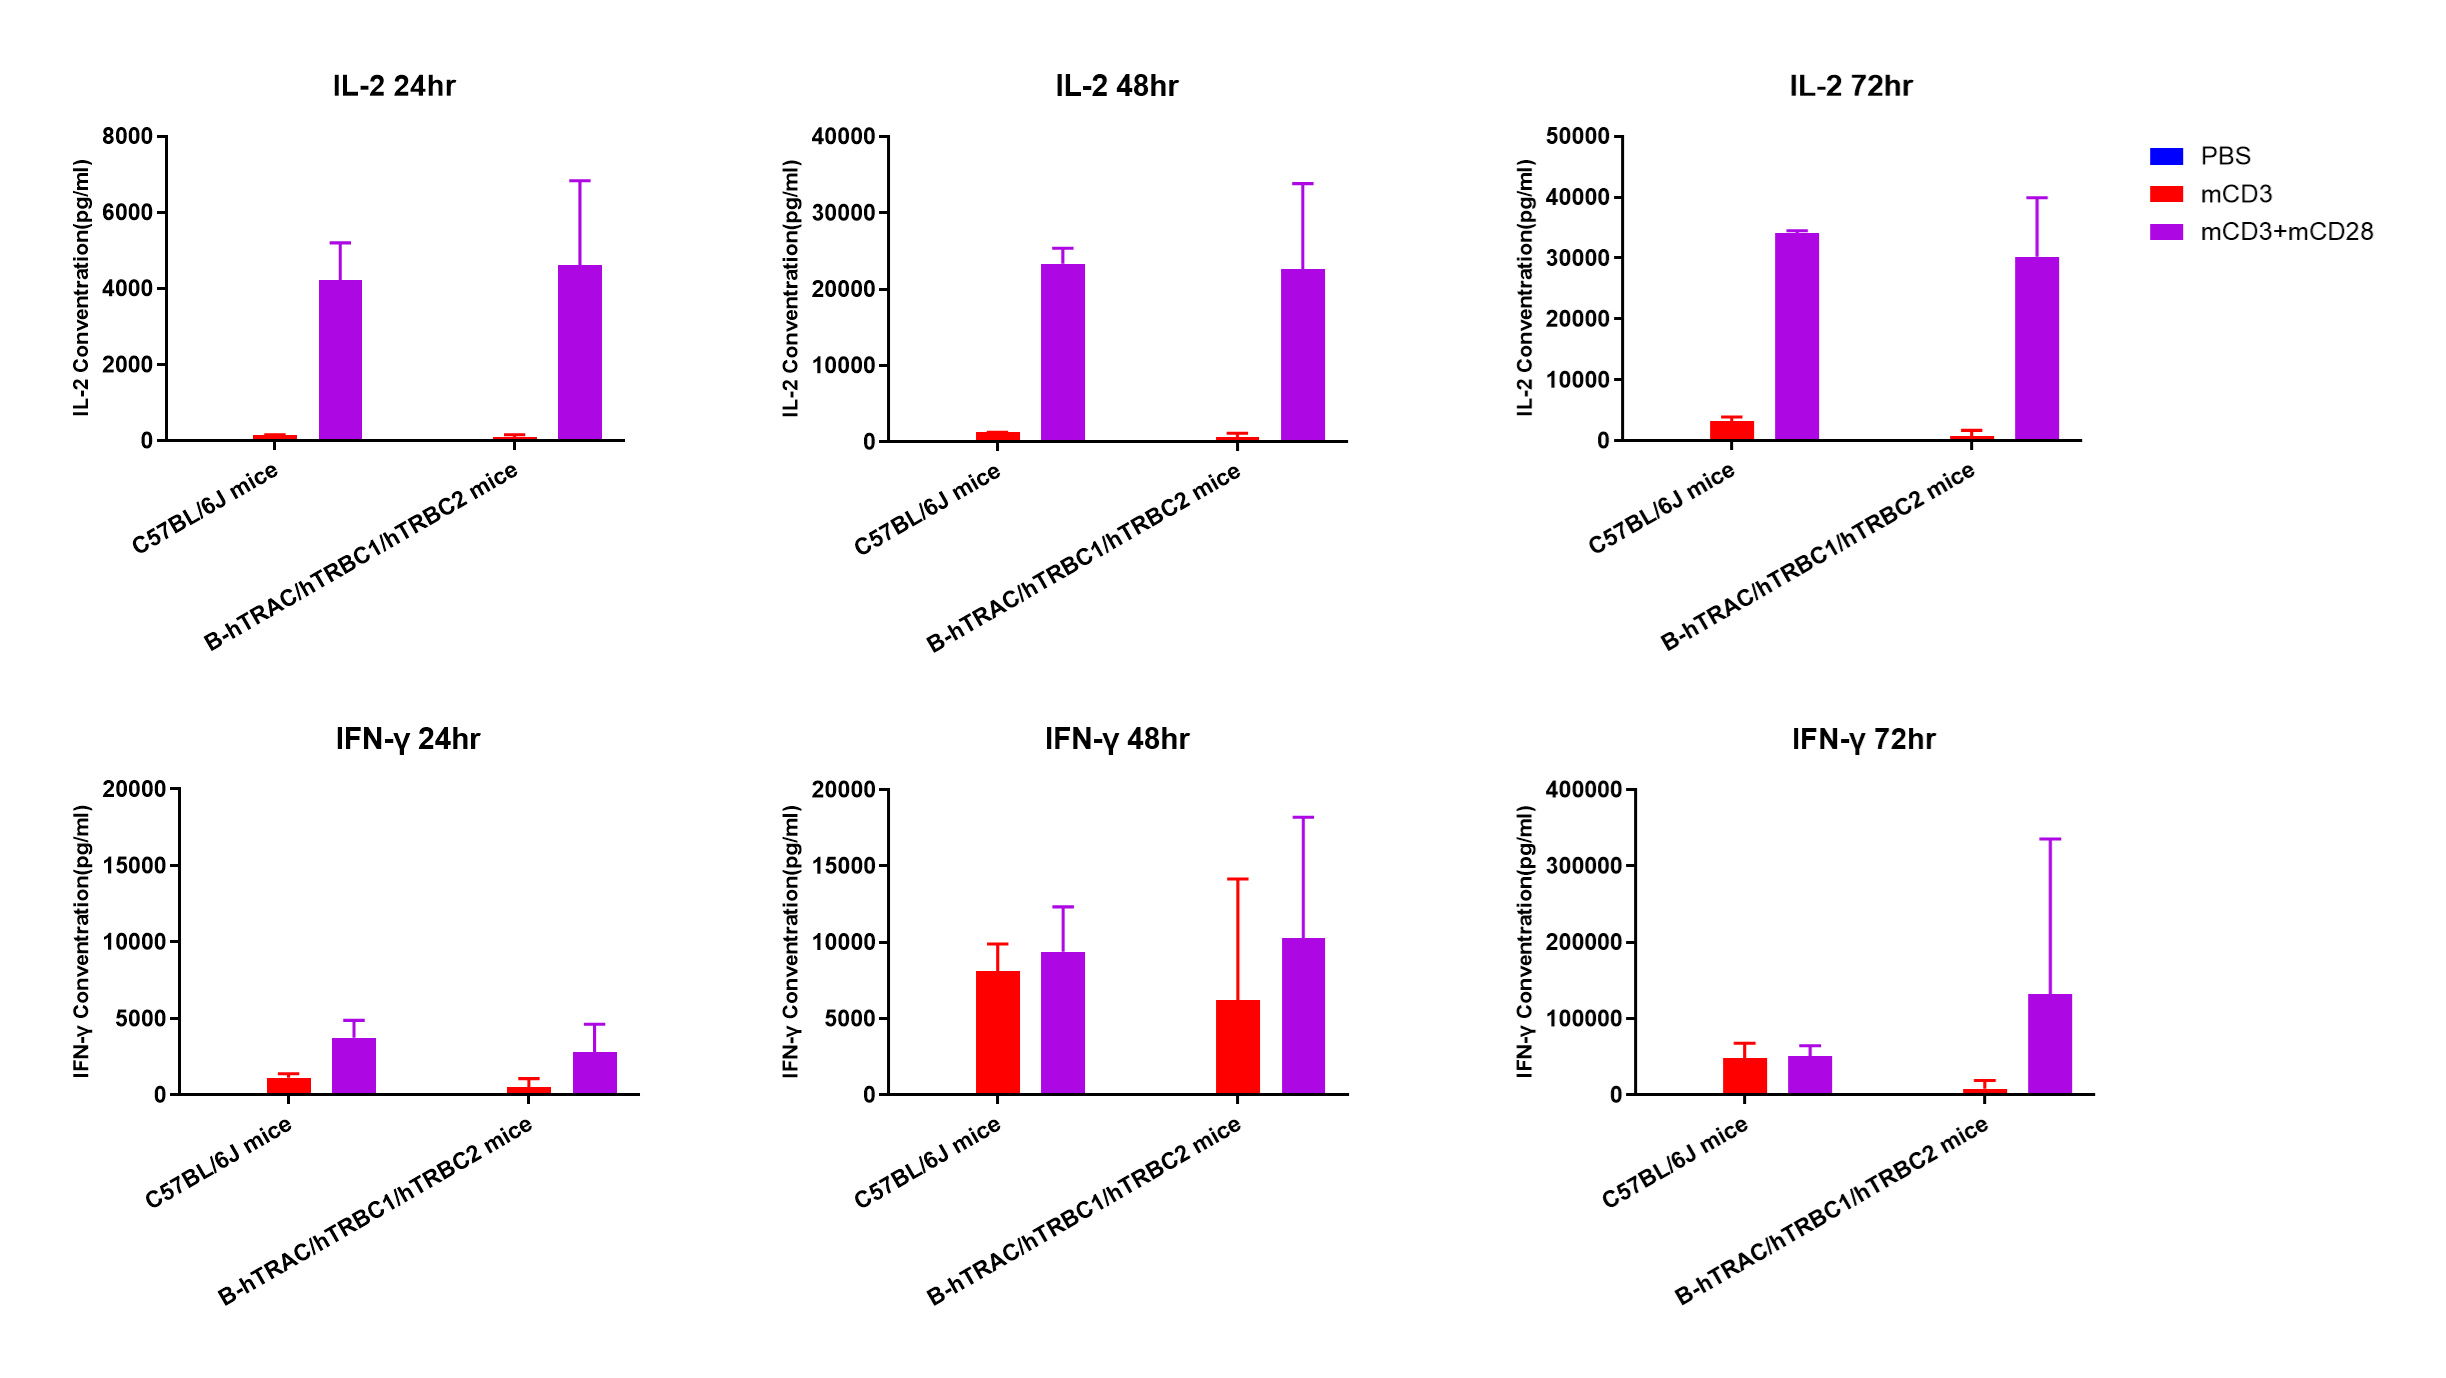
In vitro cytokine production (IFN-γ and IL-2) in B-hTRAC/hTRBC1/hTRBC2 humanized mice. T cells (2×10⁵) were isolated from the splenocytes of C57BL/6JNifdc and B-hTRAC/hTRBC1/hTRBC2 mice (female, 13-week-old, n = 3), incubated in the presence of anti-mouse CD3ε antibody (BioXCell, BE0001-1, clone 145-2C11, 2 ug/ml) and anti-mCD28 antibody (BioXCell, BE0015-1, clone 37.51, 5 ug/ml) for 24h, 48h and 72h. IFN-γ and IL-2 productions were then tested using ELISA method.