

C57BL/6-Il18bptm1(IL18BP)Bcgen/Bcgen • 112360

Gene targeting strategy for B-hIL18BP mice. The mouse Il18bp gene, which encodes the full-length protein, was replaced with the sequence of the human IL18BP counterpart gene in the B-hIL18BP mice.

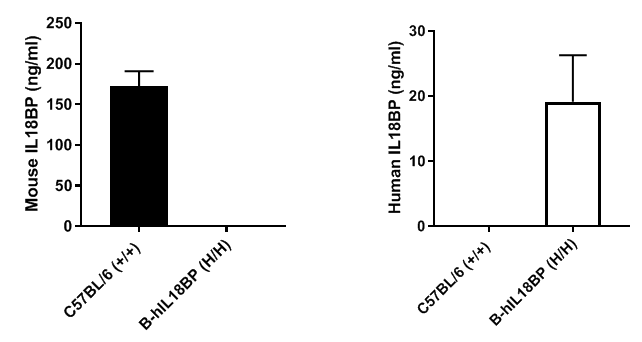
Strain specific IL18BP expression analysis in homozygous B-hIL18BP mice by ELISA. Serum was collected from wild-type mice (+/+) and homozygous B-hIL18BP mice (H/H) and analyzed by ELISA with species-specific IL18BP ELISA kit. Mouse IL18BP was detectable in wild-type mice. Human IL18BP was exclusively detectable in homozygous B-hIL18BP mice but not in wild-type mice.
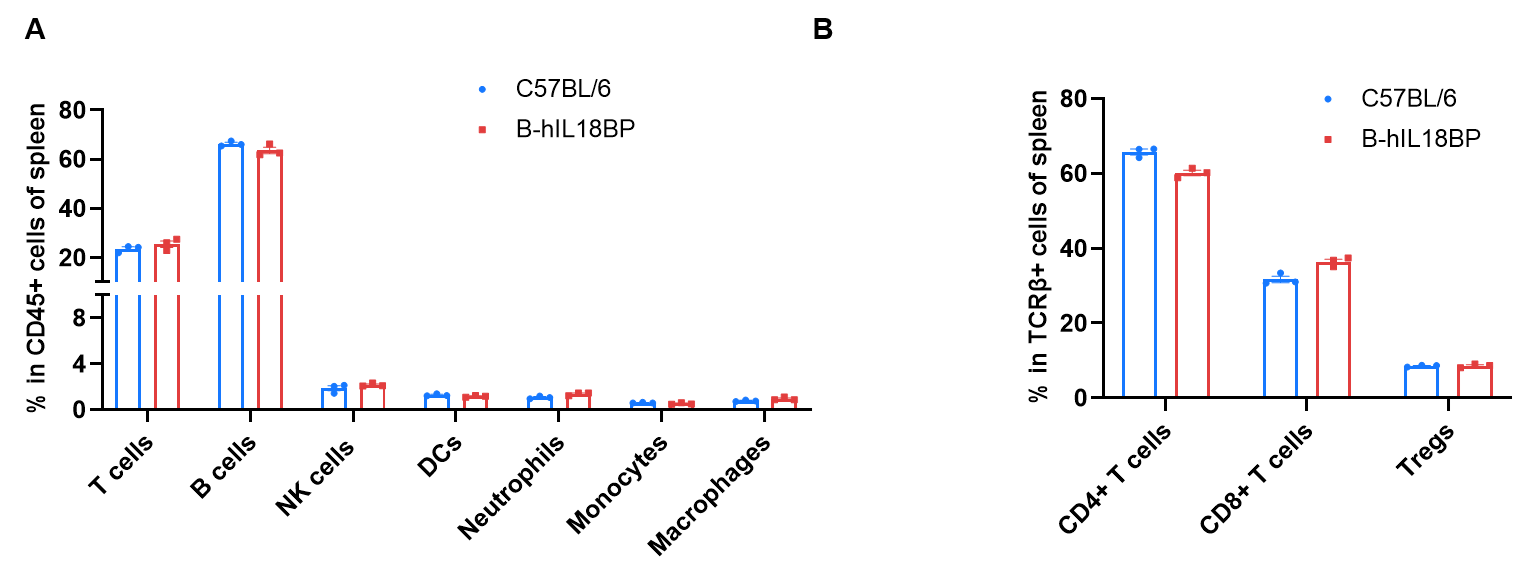
Frequency of leukocyte subpopulations in spleen by flow cytometry. Splenocytes were isolated from wild-type C57BL/6 mice (female, n=3, 6-week-old) and homozygous B-hIL18BP mice (female, n=3, 6-week-old). A. Flow cytometry analysis of the splenocytes was performed to assess the frequency of leukocyte subpopulations. B. Frequency of T cell subpopulations. Percentages of T cells, B cells, NK cells, dendritic cells, neutrophils, monocytes, macrophages, CD4+ T cells, CD8+ T cells and Tregs in B-hIL18BP mice were similar to those in C57BL/6 mice. Values are expressed as mean ± SEM. Significance was determined by two-way ANOVA test. *P < 0.05, **P < 0.01, ***p < 0.001.
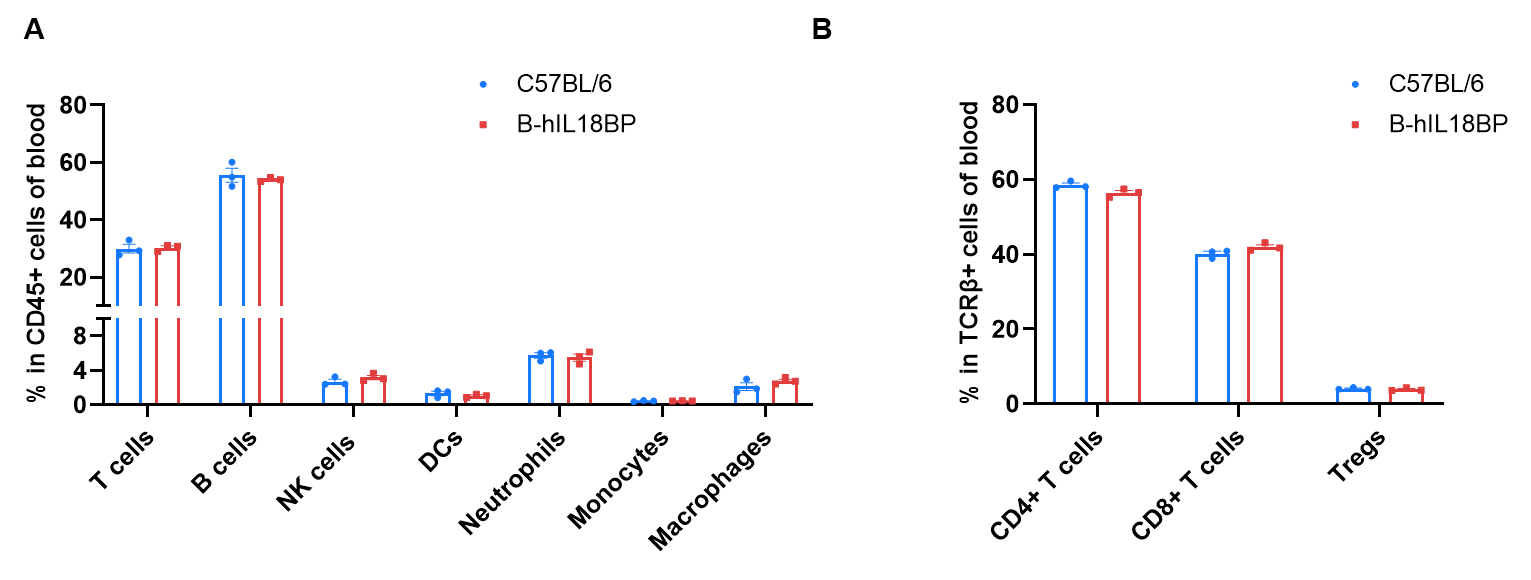
Frequency of leukocyte subpopulations in blood by flow cytometry. Blood cells were isolated from wild-type C57BL/6 mice (female, n=3, 6-week-old) and homozygous B-hIL18BP mice (female, n=3, 6-week-old). A. Flow cytometry analysis of the blood cells was performed to assess the frequency of leukocyte subpopulations. B. Frequency of T cell subpopulations. Percentages of T cells, B cells, NK cells, dendritic cells, neutrophils, monocytes, macrophages, CD4+ T cells, CD8+ T cells and Tregs in B-hIL18BP mice were similar to those in C57BL/6 mice. Values are expressed as mean ± SEM. Significance was determined by two-way ANOVA test. *P < 0.05, **P < 0.01, ***p < 0.001.
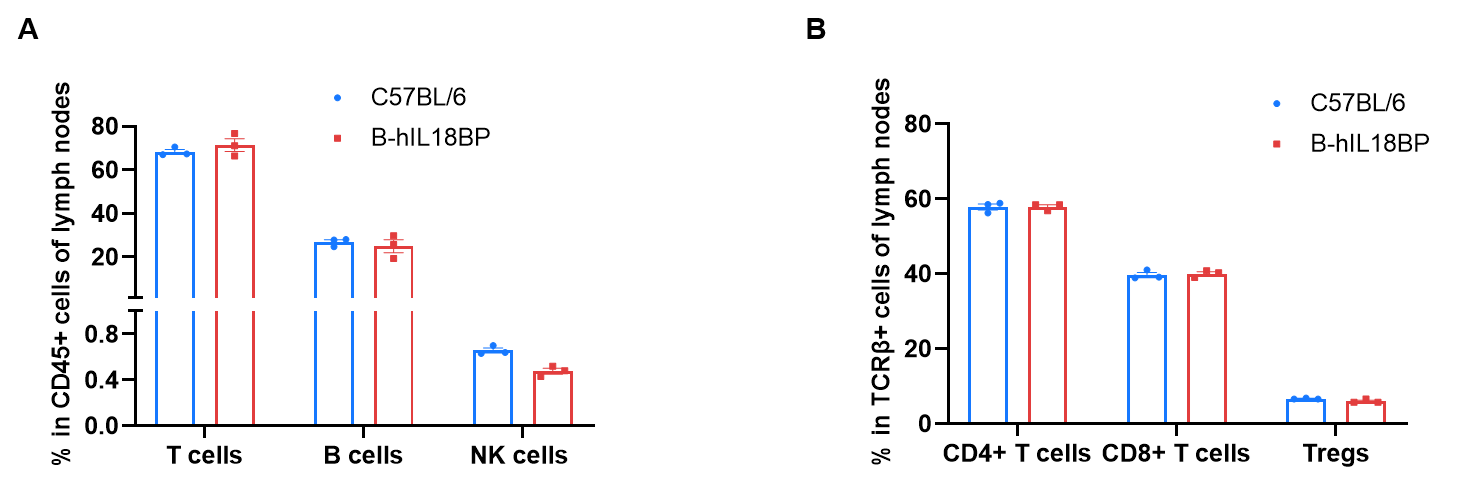
Frequency of leukocyte subpopulations in lymph nodes by flow cytometry. Lymph nodes cells were isolated from wild-type C57BL/6 mice (female, n=3, 6-week-old) and homozygous B-hIL18BP mice (female, n=3, 6-week-old). A. Flow cytometry analysis of the lymph nodes cells was performed to assess the frequency of leukocyte subpopulations. B. Frequency of T cell subpopulations. Percentages of T cells, B cells, NK cells, CD4+ T cells, CD8+ T cells and Tregs in B-hIL18BP mice were similar to those in C57BL/6 mice. Values are expressed as mean ± SEM. Significance was determined by two-way ANOVA test. *P < 0.05, **P < 0.01, ***p < 0.001.

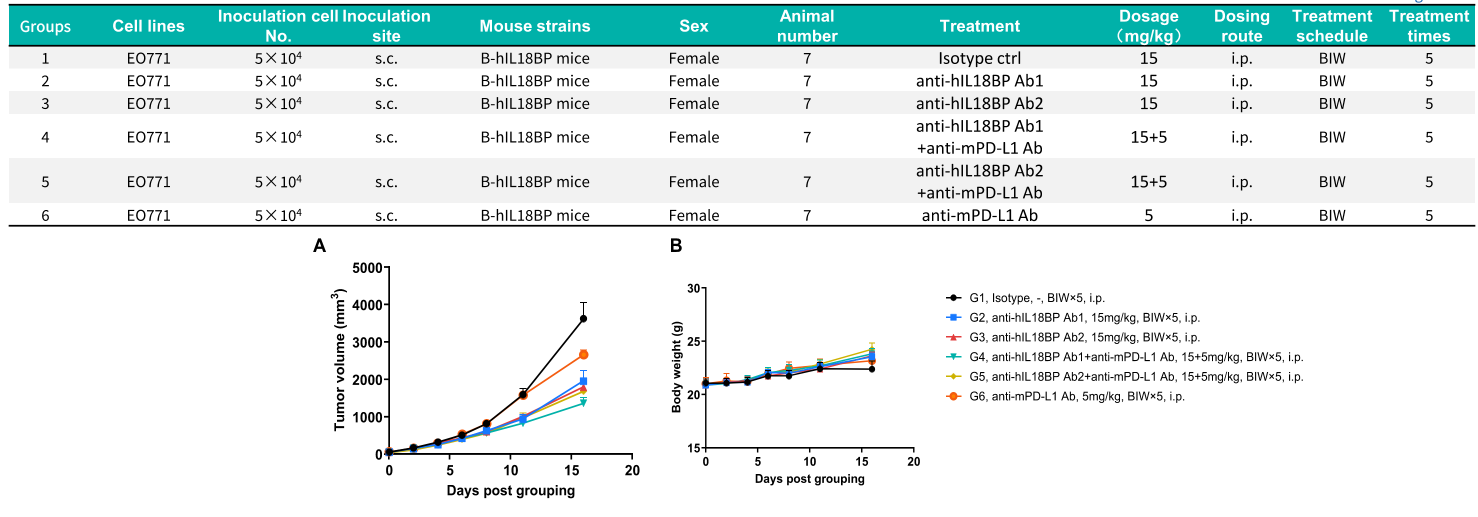
Efficacy evaluation of anti-hIL18BP antibody in combination with anti-mPD-L1 antibody in B-hIL18BP mice. EO771 murine breast cancer cells were implanted subcutaneously into homozygous B-hIL18BP mice (female, 8 weeks old, n=7). When the average tumor volume reached approximately 60 mm³, mice were randomized and subsequently administered the antibodies shown in the table via intraperitoneal injection. (A) Tumor growth curves. (B) Body weight changes during treatment. As shown in panel A, anti-hIL18BP antibodies were efficacious in controlling tumor growth in B-hIL18BP mice, and the combination of anti-hIL18 Ab with anti-mPD-L1 Ab showed greater efficacy compared to the anti-mPD-L1 Ab treatment group. This experiment was conducted in collaboration with the client. Values are expressed as mean ± SEM. The overage of this tumor model is 100%.