

C57BL/6-Il2tm1(IL2)Bcgen Il2ratm1(IL2RA)Bcgen ll2rbtm2(IL2RB)Bcgen ll2rgtm2(IL2RG)Bcgen ll15tm1(IL15)Bcgen ll15ratm1(IL15RA)Bcgen/Bcgen • 112820
이 페이지에서



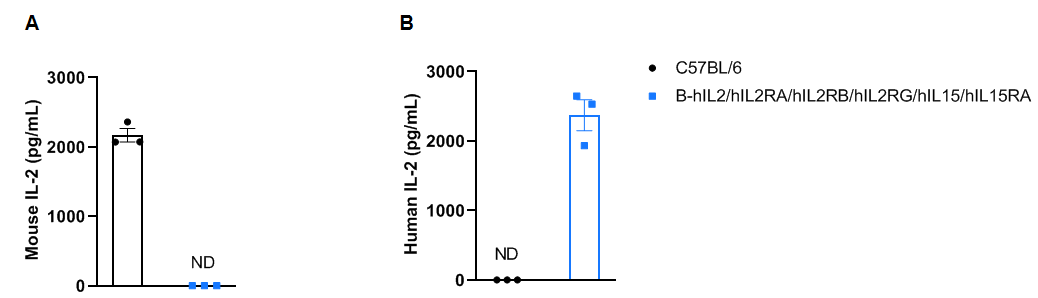
Strain specific IL2 expression analysis in wild-type C57BL/6 mice and homozygous humanized B-hIL2/hIL2RA/hIL2RB/hIL2RG/hIL15/hIL15RA mice by ELISA. Serum was collected from wild-type C57BL/6 mice and homozygous B-hIL2/hIL2RA/hIL2RB/hIL2RG/hIL15/hIL15RA mice (male, 6-week-old, n = 3) stimulated with anti-mCD3ε antibody (7.5 μg/mice) and anti-CD28 antibody (5 μg/mice) in vivo for 3 hours, and analyzed by ELISA with species-specific IL2 ELISA kit (mouse IL2: Biolegend, 431004; human IL2: Biolegend, 431804 ). Values are expressed as mean ± SEM. ND: not detectable.
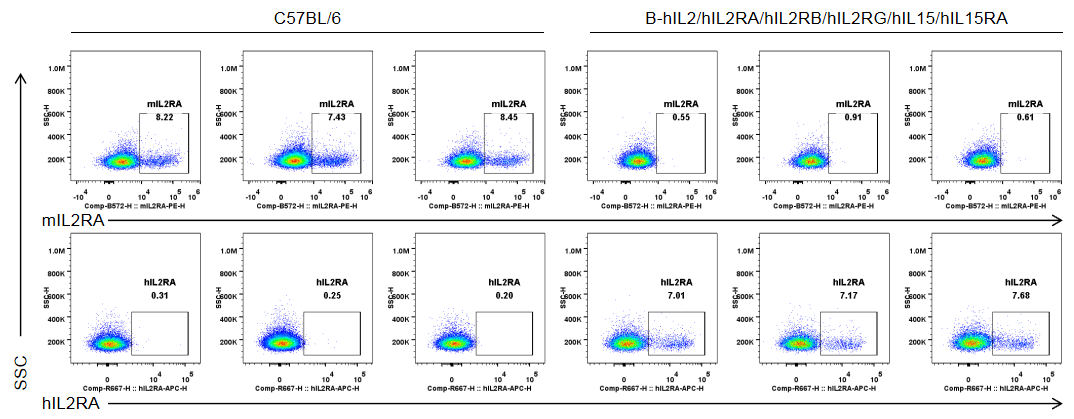
Strain specific IL2RA expression analysis in wild-type C57BL/6 mice and homozygous humanized B-hIL2/hIL2RA/hIL2RB/hIL2RG/hIL15/hIL15RA mice by flow cytometry. Splenocytes were collected from wild-type C57BL/6 mice and homozygous B-hIL2/hIL2RA/hIL2RB/hIL2RG/hIL15/hIL15RA/hIL15/hIL15RA mice (male, 6-week-old, n = 3) stimulated with anti-CD3ε antibody (7.5 μg/mice, i.p.) and anti-mCD28 antibody (5 μg/mice, i.p.) in vivo for 3 hours, and analyzed by flow cytometry with species-specific anti-IL2RA antibody (anti-mIL2RA antibody: Biolegend, 102008. anti-hIL2RA antibody: Biolegend, 302610).
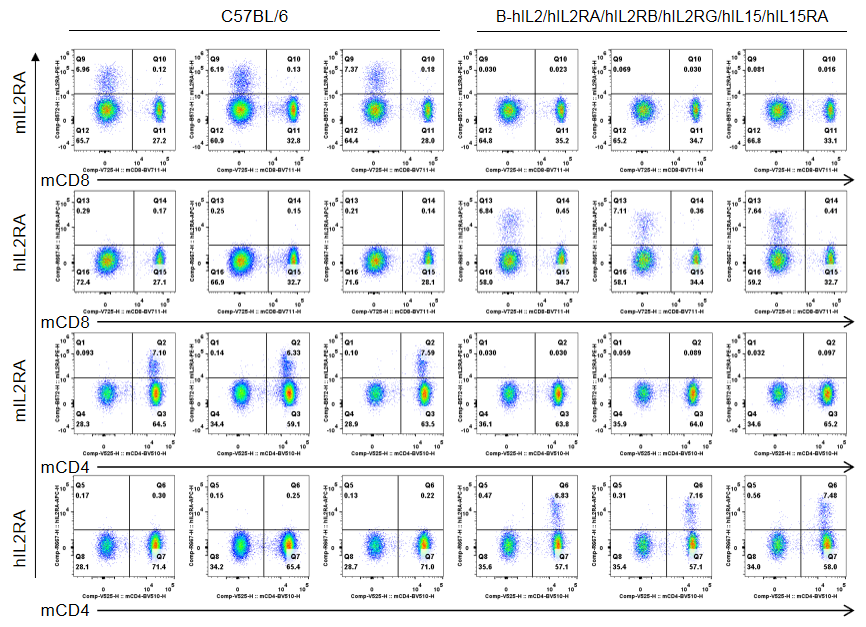
Strain specific IL2RA expression analysis in wild-type C57BL/6 mice and homozygous humanized B-hIL2/hIL2RA/hIL2RB/hIL2RG/hIL15/hIL15RA mice by flow cytometry. Splenocytes were collected from wild-type C57BL/6 mice and homozygous B-hIL2/hIL2RA/hIL2RB/hIL2RG/hIL15/hIL15RA mice (male, 6-week-old, n = 3) stimulated with anti-CD3ε antibody (7.5 μg/mice, i.p.) and anti-mCD28 antibody (5 μg/mice, i.p.) in vivo for 3 hours, and analyzed by flow cytometry with species-specific anti-IL2RA antibody (anti-mIL2RA antibody: Biolegend, 102008. anti-hIL2RA antibody: Biolegend, 302610).
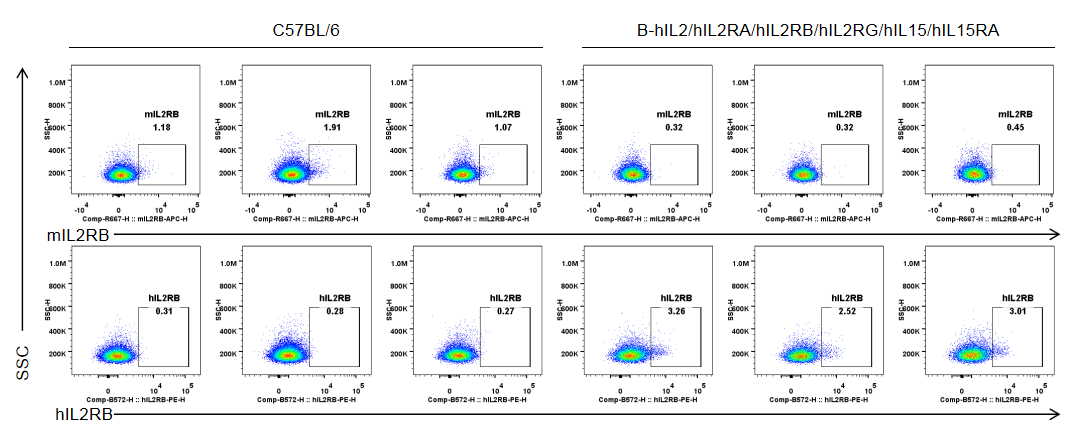
Strain specific IL2RB expression analysis in homozygous B-hIL2/hIL2RA/hIL2RB/hIL2RG/hIL15/hIL15RA mice by flow cytometry. Splenocytes were collected from wild-type C57BL/6 mice (male, 6-week-old, n=3/group) and homozygous B-hIL2/hIL2RA/hIL2RB/hIL2RG/hIL15/hIL15RA mice (male, 6-week-old, n=3/group) stimulated with anti-CD3ε antibody (7.5 μg/mice, i.p.) and anti-mCD28 antibody (5 μg/mice, i.p.) in vivo for 3 h, and analyzed by flow cytometry with species-specific anti-IL2RB antibody (anti-mIL2RB antibody: Biolegend, 105911. anti-hIL2RB antibody: Biolegend, 339005). mIL2RB was only detectable in wild-type mice, and hIL2RB was exclusively detectable in T cells in homozygous B-hIL2/hIL2RA/hIL2RB/hIL2RG/hIL15/hIL15RA mice.
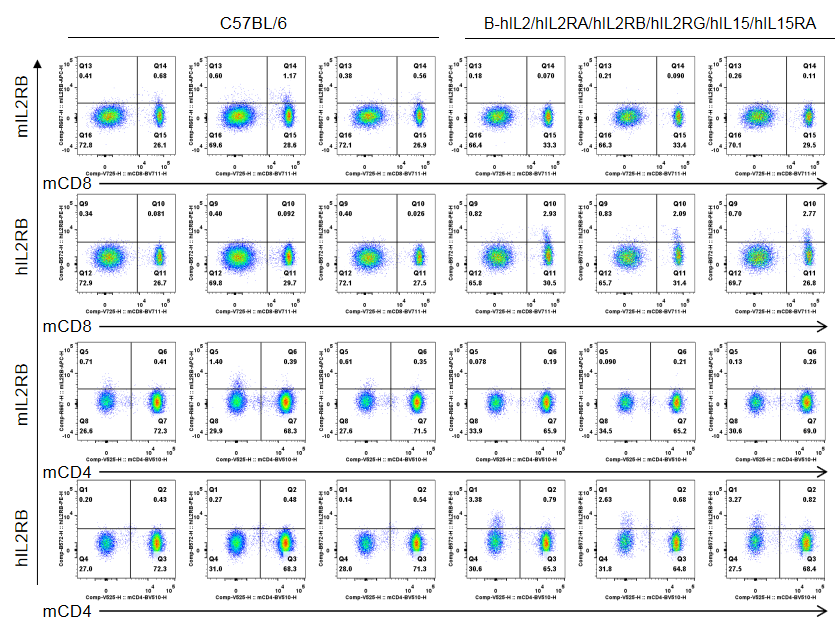
Strain specific IL2RB expression analysis in homozygous B-hIL2/hIL2RA/hIL2RB/hIL2RG/hIL15/hIL15RA mice by flow cytometry. Splenocytes were collected from wild-type C57BL/6 mice (male, 6-week-old, n=3/group) and homozygous B-hIL2/hIL2RA/hIL2RB/hIL2RG/hIL15/hIL15RA mice (male, 6-week-old, n=3/group) stimulated with anti-CD3ε antibody (7.5 μg/mice, i.p.) and anti-mCD28 antibody (5 μg/mice, i.p.) in vivo for 3 h, and analyzed by flow cytometry with species-specific anti-IL2RB antibody (anti-mIL2RB antibody: Biolegend, 105911. anti-hIL2RB antibody: Biolegend, 339005). mIL2RB was only detectable in wild-type mice, and hIL2RB was exclusively detectable in CD8+ T cells in homozygous B-hIL2/hIL2RA/hIL2RB/hIL2RG/hIL15/hIL15RA mice.
Mice used in the experiment: male, 6-week-old, n=3/group.
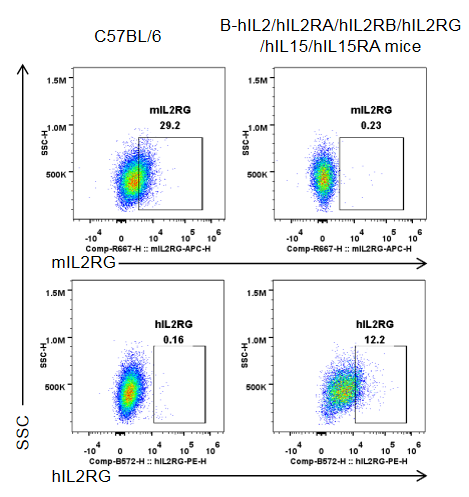
Strain specific IL2RG expression analysis in homozygous B-hIL2/hIL2RA/hIL2RB/hIL2RG/hIL15/hIL15RA mice by flow cytometry. Splenocytes were collected from wild-type C57BL/6 mice (male, 10-week-old, 1 mice/group) and homozygous B-hIL2/hIL2RA/hIL2RB/hIL2RG/hIL15/hIL15RA mice (male, 10-week-old, 1 mice/group. ), and cultured in 96-well plates pre-coated with 2 μg/mL anti-mCD3ε and 5 μg/mL anti-mCD28 antibody for 24 h, and then cells were harvested and analyzed by flow cytometry with species-specific anti-IL2RG antibody (anti-mIL2RG antibody: Biolegend, 132308. anti-hIL2RG antibody: Biolegend, 338606). mIL2RG was only detectable in wild-type mice, while hIL2RG was exclusively detectable in T cells in homozygous B-hIL2/hIL2RA/hIL2RB/hIL2RG/hIL15/hIL15RA mice.
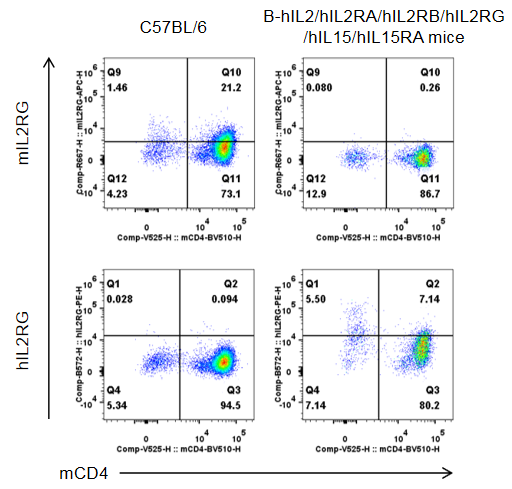
Strain specific IL2RG expression analysis in homozygous B-hIL2/hIL2RA/hIL2RB/hIL2RG/hIL15/hIL15RA mice by flow cytometry. Splenocytes were collected from wild-type C57BL/6 mice (male, 10-week-old, 1 mice/group) and homozygous B-hIL2/hIL2RA/hIL2RB/hIL2RG/hIL15/hIL15RA mice (male, 10-week-old, 1 mice/group. ), and cultured in 96-well plates pre-coated with 2 μg/mL anti-mCD3ε and 5 μg/mL anti-mCD28 antibody for 24 h, and then cells were harvested and analyzed by flow cytometry with species-specific anti-IL2RG antibody (anti-mIL2RG antibody: Biolegend, 132308. anti-hIL2RG antibody: Biolegend, 338606). mIL2RG was only detectable in wild-type mice, while hIL2RG was exclusively detectable in CD4+T cells in homozygous B-hIL2/hIL2RA/hIL2RB/hIL2RG/hIL15/hIL15RA mice.
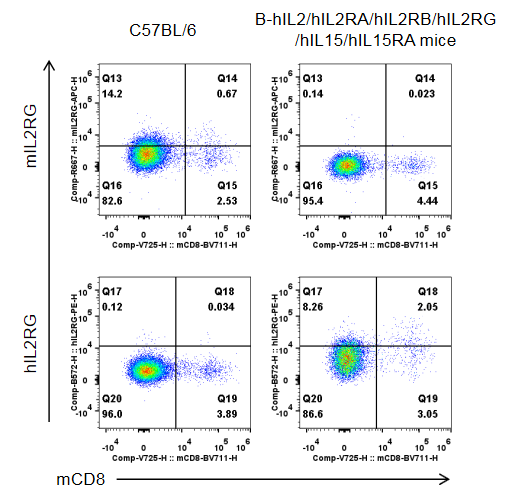
Strain specific IL2RG expression analysis in homozygous B-hIL2/hIL2RA/hIL2RB/hIL2RG/hIL15/hIL15RA mice by flow cytometry. Splenocytes were collected from wild-type C57BL/6 mice (male, 10-week-old, 1 mice/group) and homozygous B-hIL2/hIL2RA/hIL2RB/hIL2RG/hIL15/hIL15RA mice (male, 10-week-old, 1 mice/group), and cultured in 96-well plates pre-coated with 2 μg/mL anti-mCD3ε and 5 μg/mL anti-mCD28 antibody for 24 h, and then cells were harvested and analyzed by flow cytometry with species-specific anti-IL2RG antibody (anti-mIL2RG antibody: Biolegend, 132308. anti-hIL2RG antibody: Biolegend, 338606). mIL2RG was only detectable in wild-type mice, while hIL2RG was exclusively detectable in CD8+T cells in homozygous B-hIL2/hIL2RA/hIL2RB/hIL2RG/hIL15/hIL15RA mice.
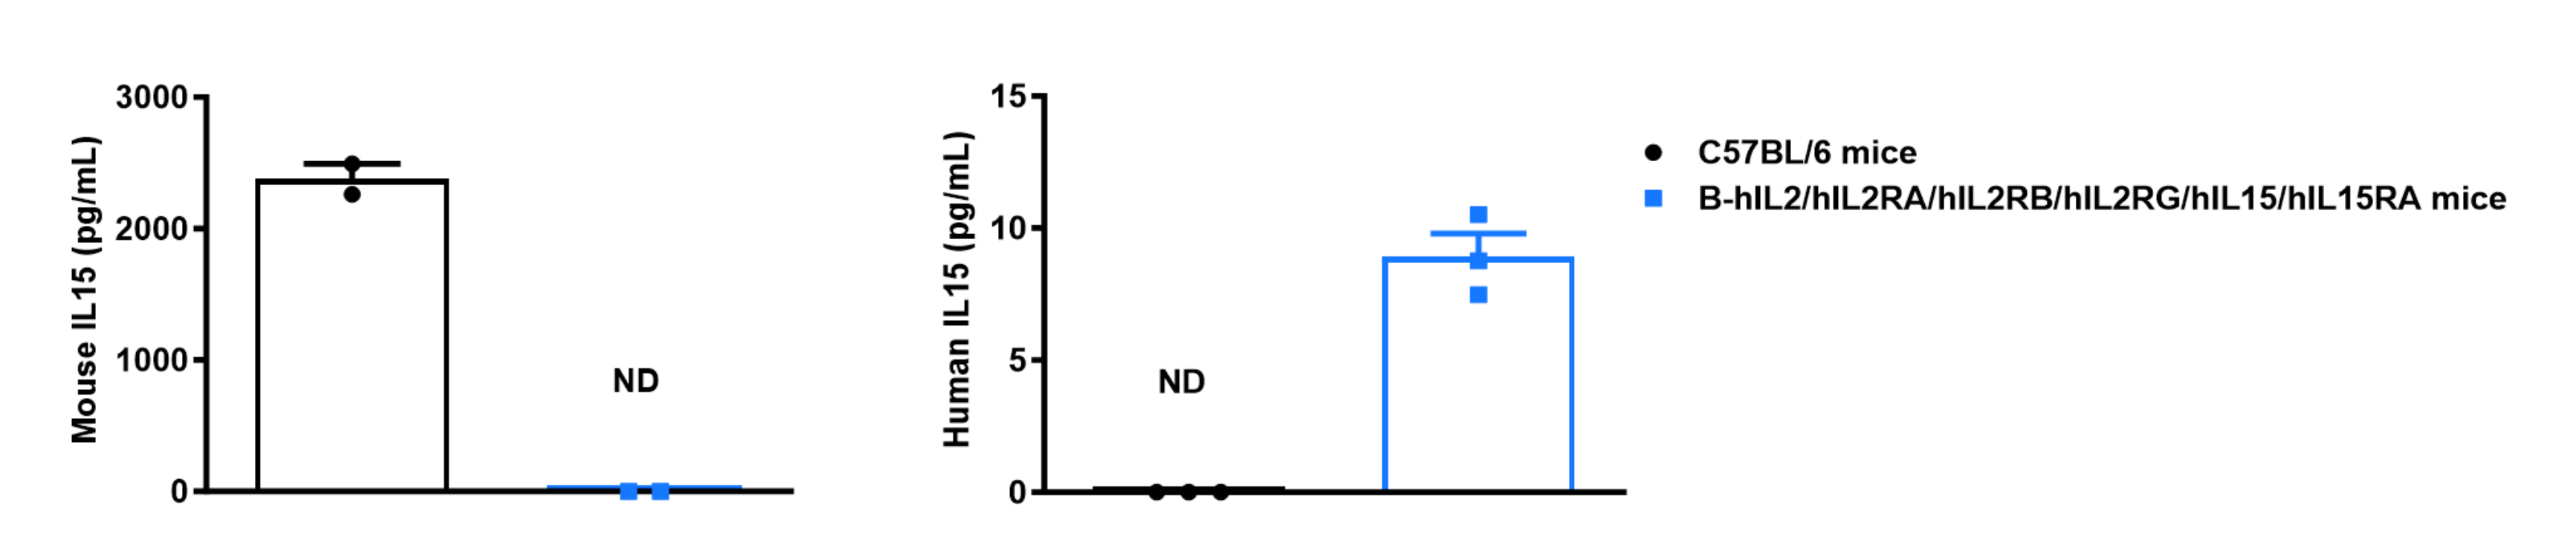
Strain specific IL15 expression analysis in wild-type C57BL/6 mice and homozygous humanized B-hIL2/hIL2RA/hIL2RB/hIL2RG/hIL15/hIL15RA mice by ELISA. Serum was collected from wild-type C57BL/6 mice and homozygous B-hIL2/hIL2RA/hIL2RB/hIL2RG/hIL15/hIL15RA mice (male, 6-week-old, n = 3) stimulated with APAP for 24 hours. Expression level of human IL15 were analyzed by ELISA anti-human IL15 ELISA kit (R&D systems, D1500). Values are expressed as mean ± SEM. ND: not detectable.
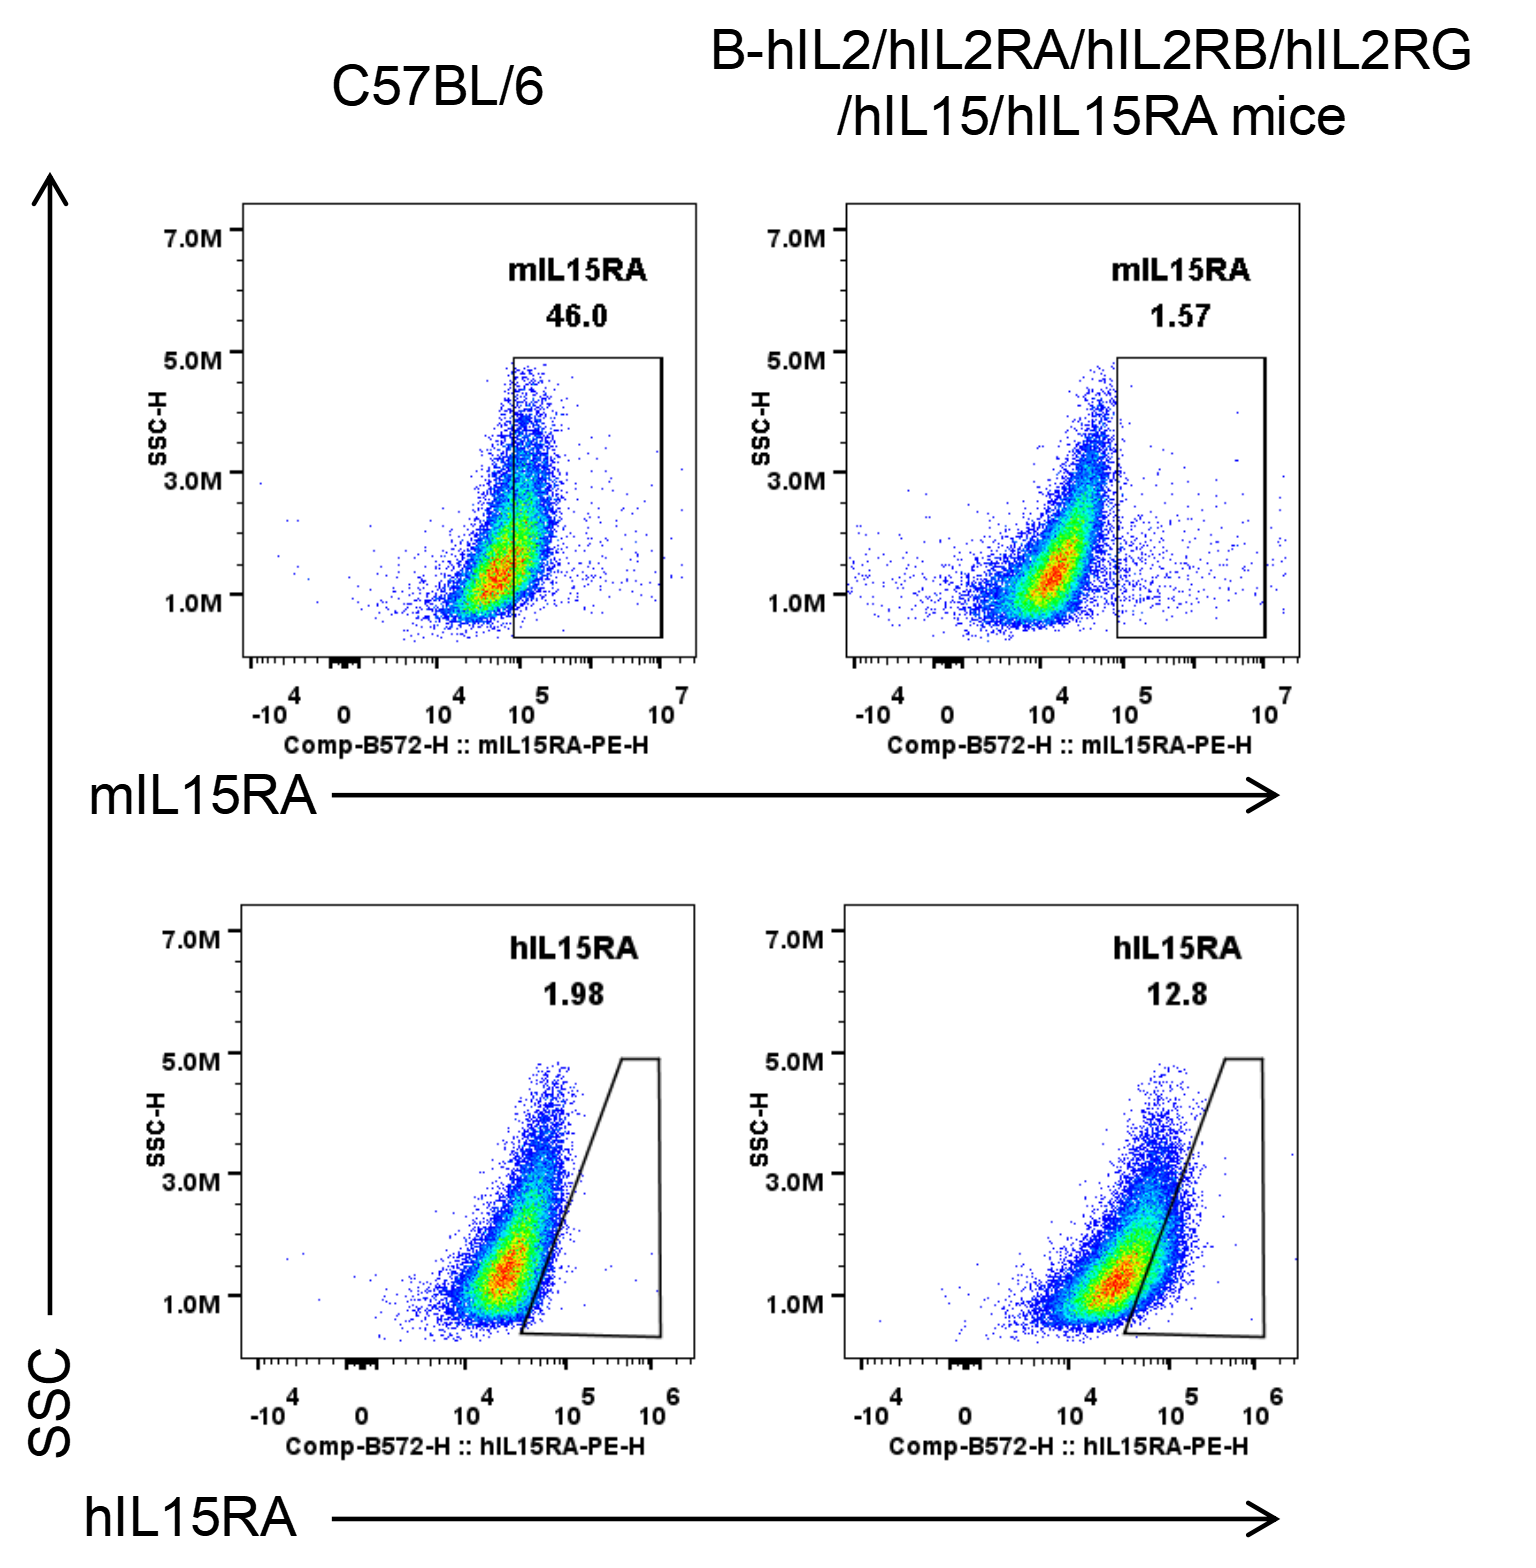
Strain specific IL2RB expression analysis in wild-type C57BL/6 mice and homozygous humanized B-hIL2/hIL2RA/hIL2RB/hIL2RG/hIL15/hIL15RA mice by flow cytometry. Bone marrow derived dendritic cells (BMDCs) were produced by culturing the bone marrow from wild-type C57BL/6 mice and homozygous B-hIL2/hIL2RA/hIL2RB/hIL2RG/hIL15/hIL15RA mice, which were stimulated with LPS in vitro. Protein expression was analyzed with anti-mouse IL15RA antibody (BD, 568235) and anti-human IL15RA antibody (Biolegend, 330207) by flow cytometry.

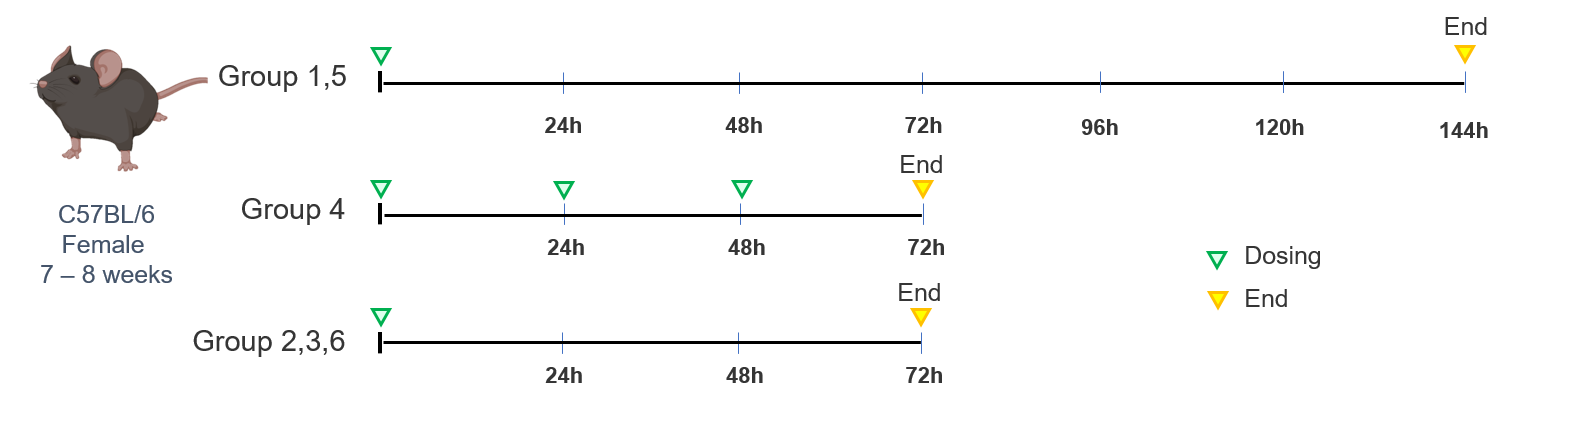
Note: This experiment was performed by the client using B-hIL2/hIL2RA/hIL2RB/hIL2RG/hIL15/hIL15RA mice. All the other materials were provided by the client.
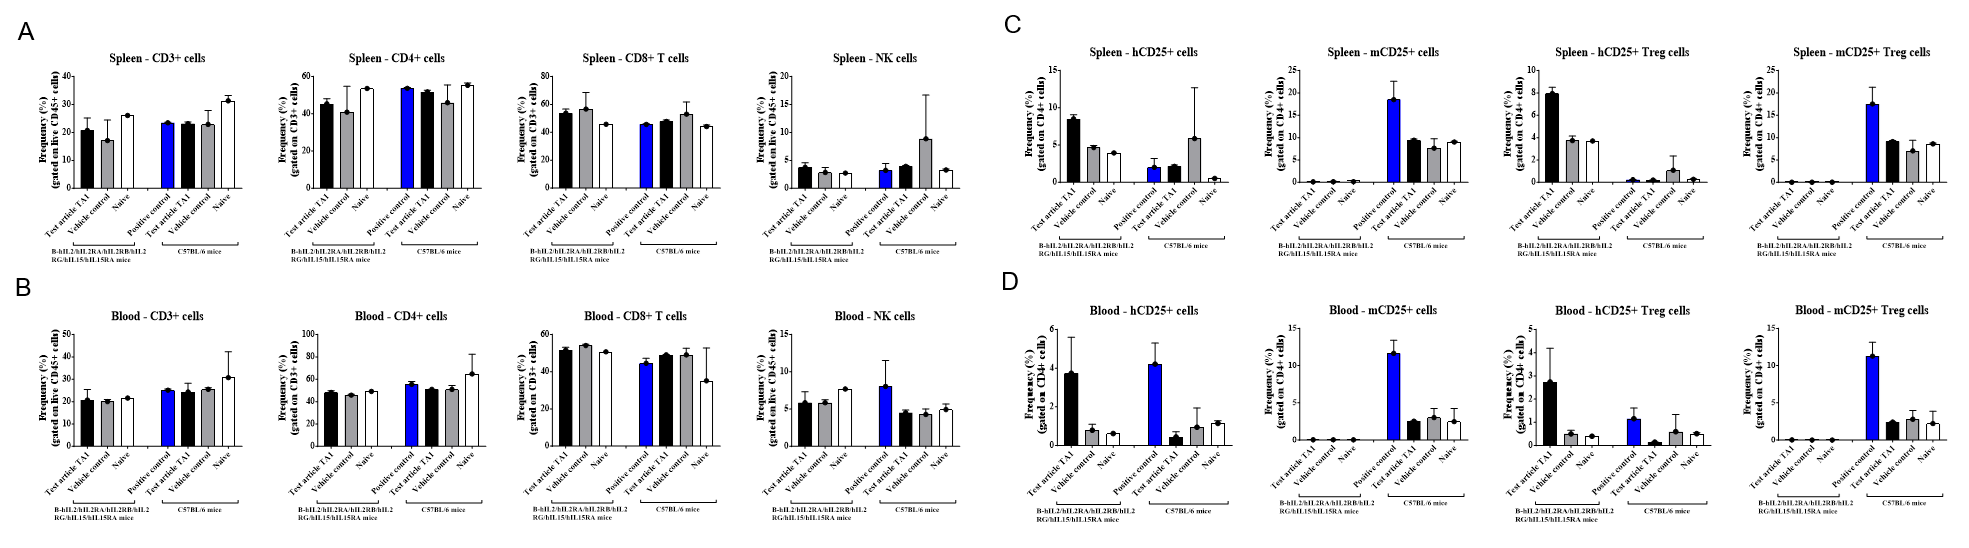
B-hIL2/hIL2RA/hIL2RB/hIL2RG/hIL15/hIL15RA mice and C57BL/6 mice were treated with test article TA1, vehicle control, positive control, or no treatment (naive group). At the endpoint of treatment, spleen (A, C) and blood (B, D) were analyzed for the proportions of T cells and NK cells (A , B) as well as the proportions of CD25 (also known as IL2RA) expressing cells (C, D). The results showed that only human CD25 (hCD25) was detected in CD4+T cells and Tregs of B-hIL2/hIL2RA/hIL2RB/hIL2RG/hIL15/hIL15RA mice, while mouse CD25 (mCD25) was not detected (C, D). Since the anti-hCD25 antibody can cross-react with both hCD25 and mCD25, positive cell populations were also detected in C57BL/6 mice using anti-hCD25 antibody (C, D). Compared to vehicle control group and naive group, the proportions of CD3+ T cells, CD4+ T cells, CD8+ T cells and NK cells in spleen and blood of B-hIL2/hIL2RA/hIL2RB/hIL2RG/hIL15/hIL15RA mice treated with test article TA1 did not change (A, B), and test article TA1 only expanded hCD25 positive Tregs in B-hIL2/hIL2RA/hIL2RB/hIL2RG/hIL15/hIL15RA mice (C, D).
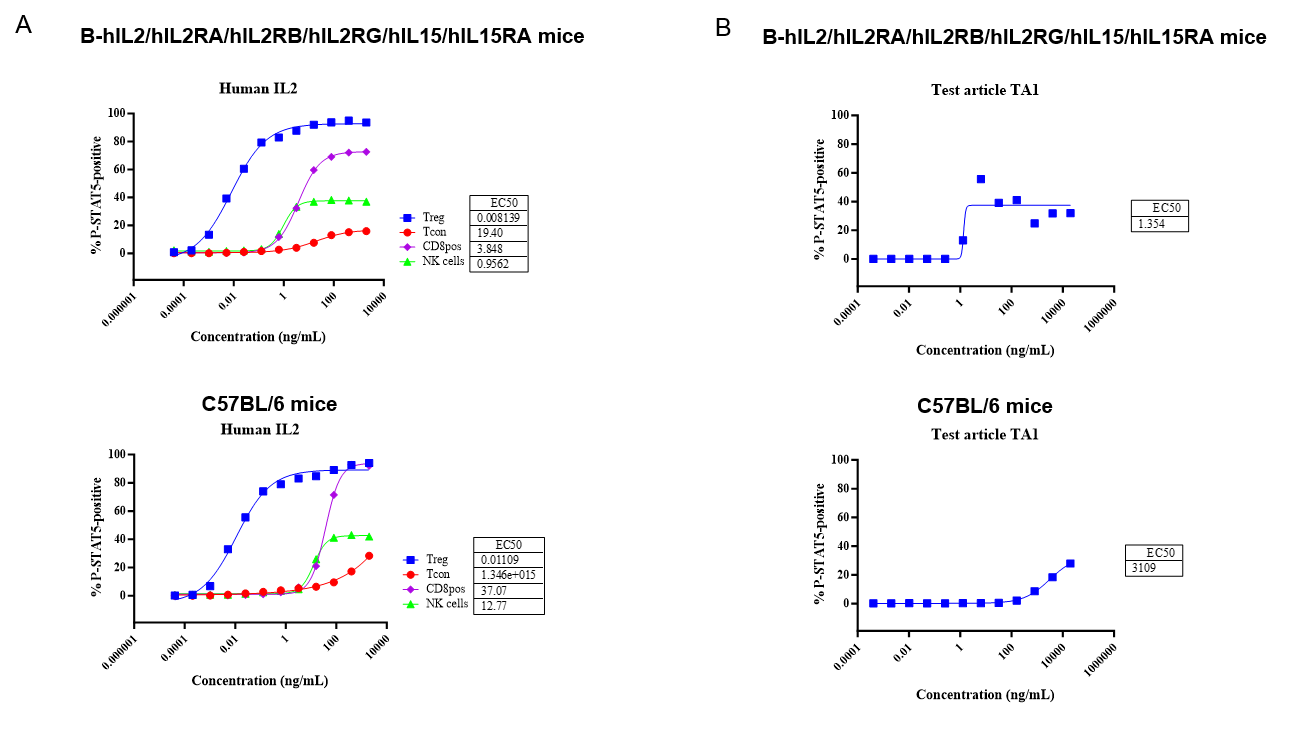
Splenocytes from B-hIL2/hIL2RA/hIL2RB/hIL2RG/hIL15/hIL15RA mice and C57BL/6 mice were treated with different concentrations of human IL2 or test article TA1 for 20 min, respectively. Cells were collected and assessed for STAT5 phosphorylation (pSTAT5). As shown in the figure, human IL2 treatment showed decreased selectivity towards Tregs (A), and test article TA1 can effectively activate Treg cells in B-hIL2/hIL2RA/hIL2RB/hIL2RG/hIL15/hIL15RA mice compared to C57BL/6 mice(B).
Note: This experiment was performed by the client using B-hIL2/hIL2RA/hIL2RB/hIL2RG/hIL15/hIL15RA mice. All the other materials were provided by the client.
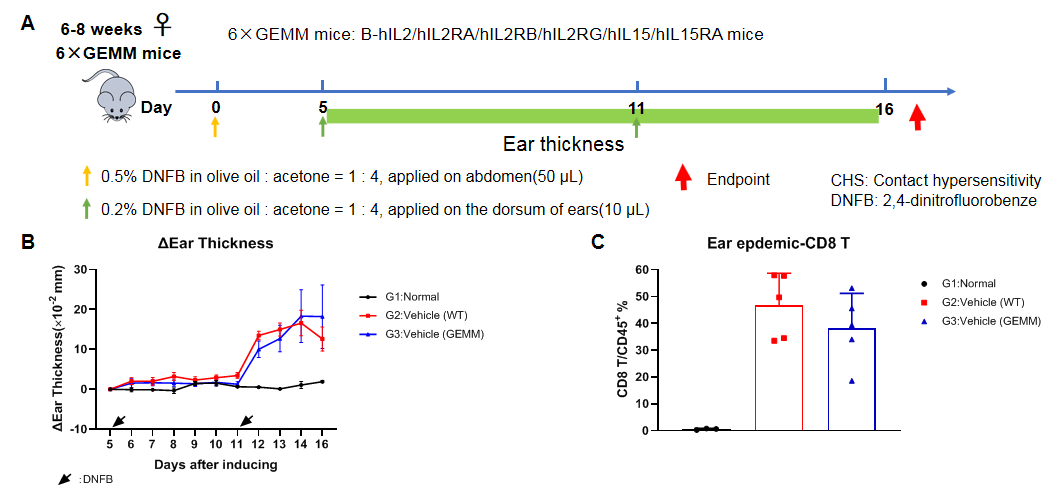
Exposure schedules and procedures for the DNFB-induced CHS model and analysis of characteristics in CHS model based on wild-type C57BL/6 and B-hIL2/hIL2RA/hIL2RB/hIL2RG/hIL15/hIL15RA mice. (A) The timeline of animal handling for the CHS experiment. (B) Change of ear thickness. (C) Frequency of CD8+ T cells within the ear epdemic site, determined by flow cytometry. The contact hypersensitivity(CHS) model can be established successfully in the B-hIL2/hIL2RA/hIL2RB/hIL2RG/hIL15/hIL15RA mice.
Note: This experiment was performed by the client using B-hIL2/hIL2RA/hIL2RB/hIL2RG/hIL15/hIL15RA mice. All the other materials were provided by the client.

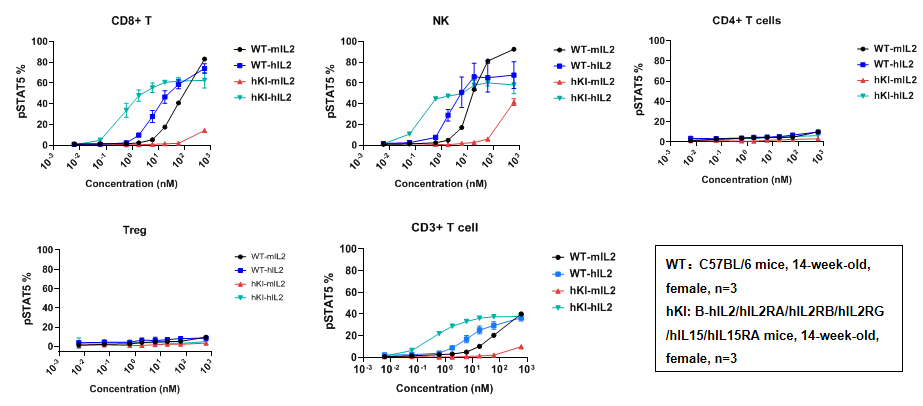
Intracellular phosphorylation of STAT5 analysis in splenocytes by flow cytometry. Splenocytes at 2x10^6/well (96-well plate) were treated with different concentrations of IL2 for 30 min. Cells were collected and assessed for pSTAT5 in the different immune cells. As shown in the figure, IL2 induced pSTAT5 in T cells and NK cells in a dose dependent manner; however, no pSTAT5 induction was observed in CD4+ T cells and Tregs.
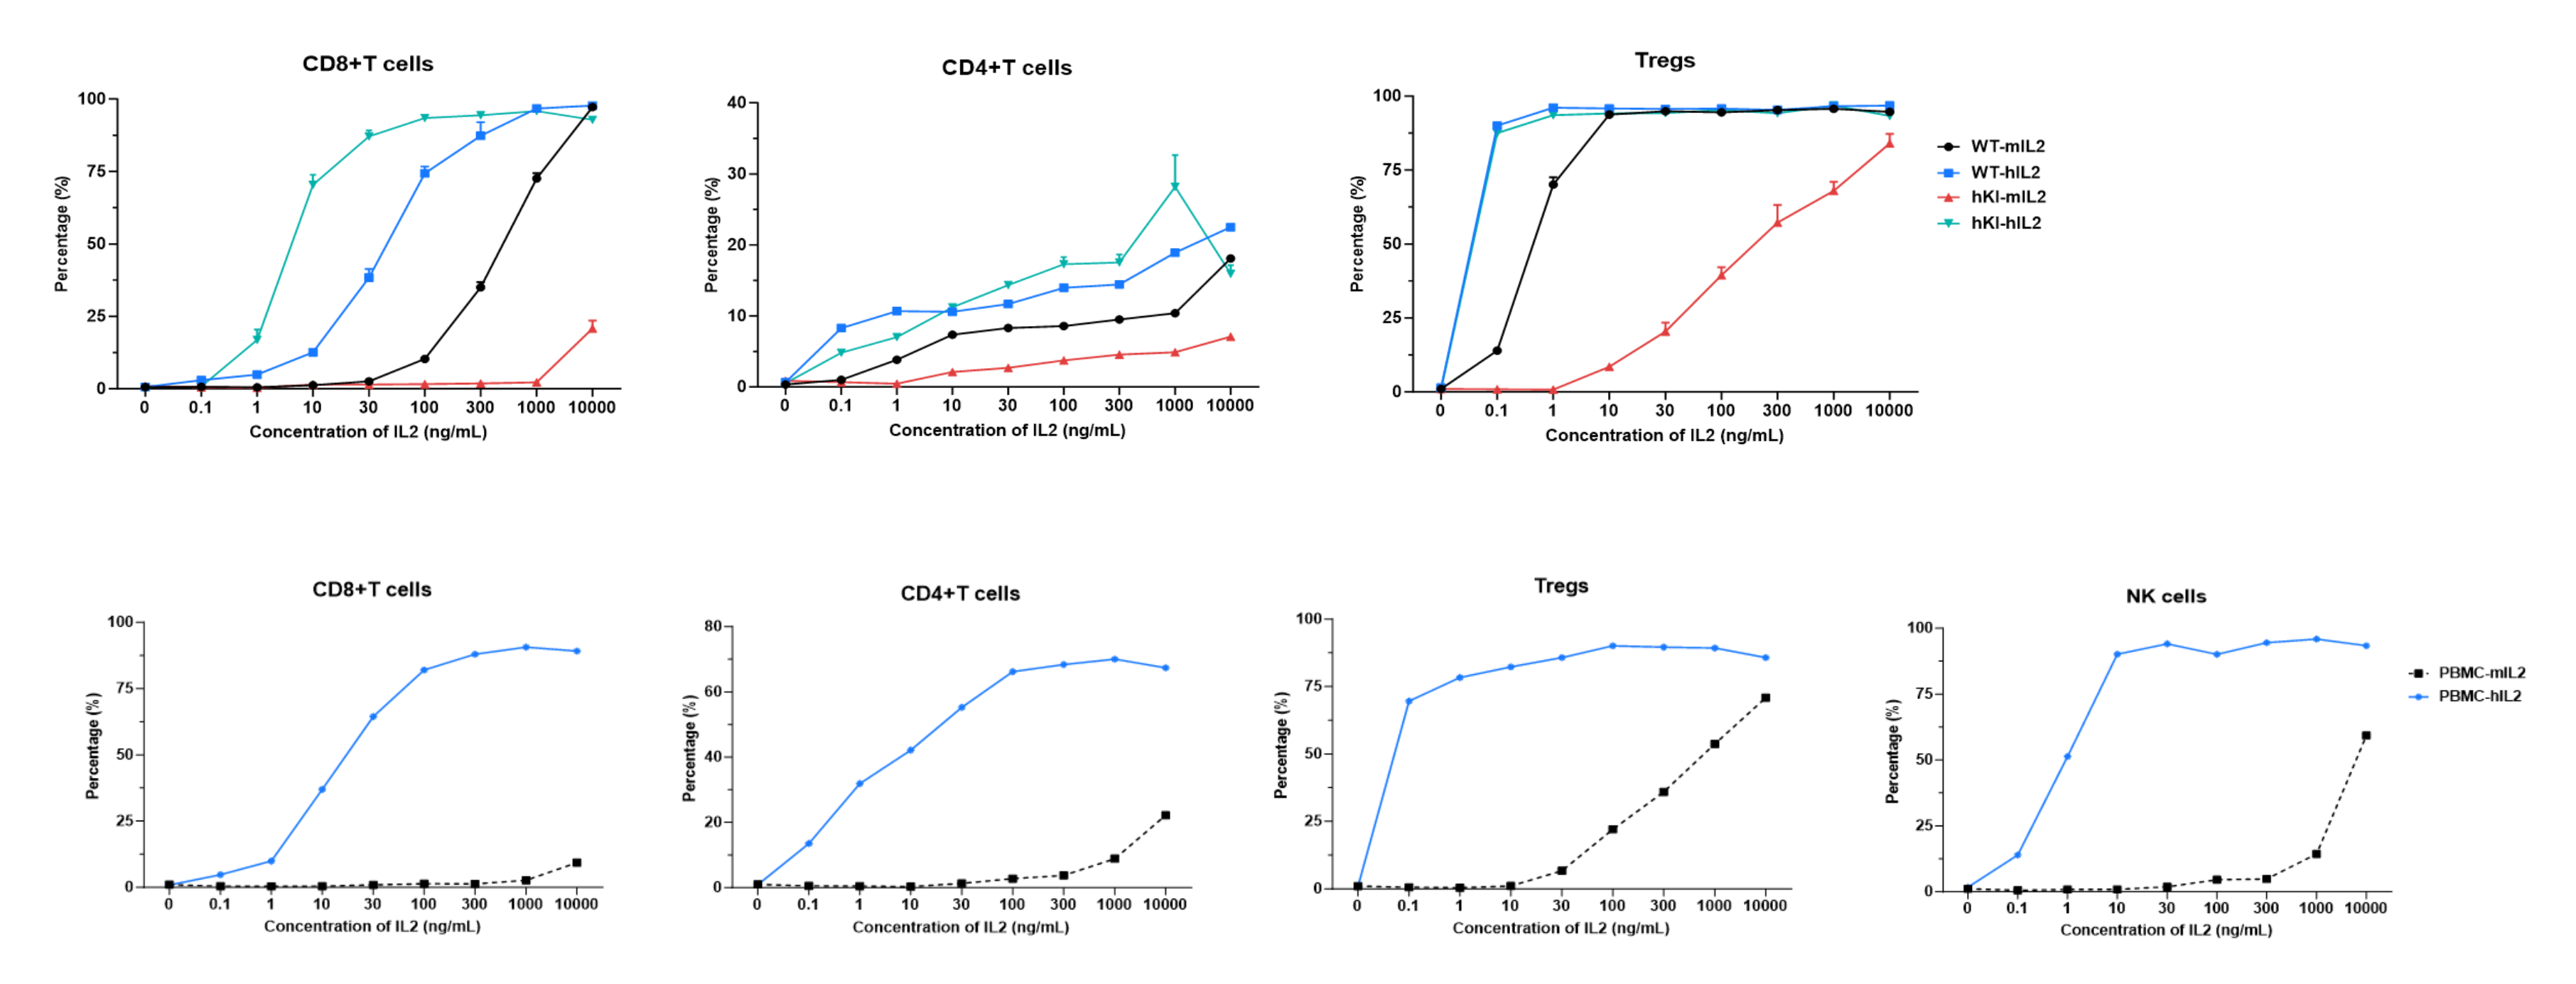
Intracellular phosphorylation of STAT5 analysis in splenocytes and human PBMC by flow cytometry. Splenocytes at 2x10⁶/well and human PBMC at 5 x 10⁵/well were treated with different concentrations of mouse or human IL2 for 30 min. Cells were collected and assessed for pSTAT5 in the different immune cells.
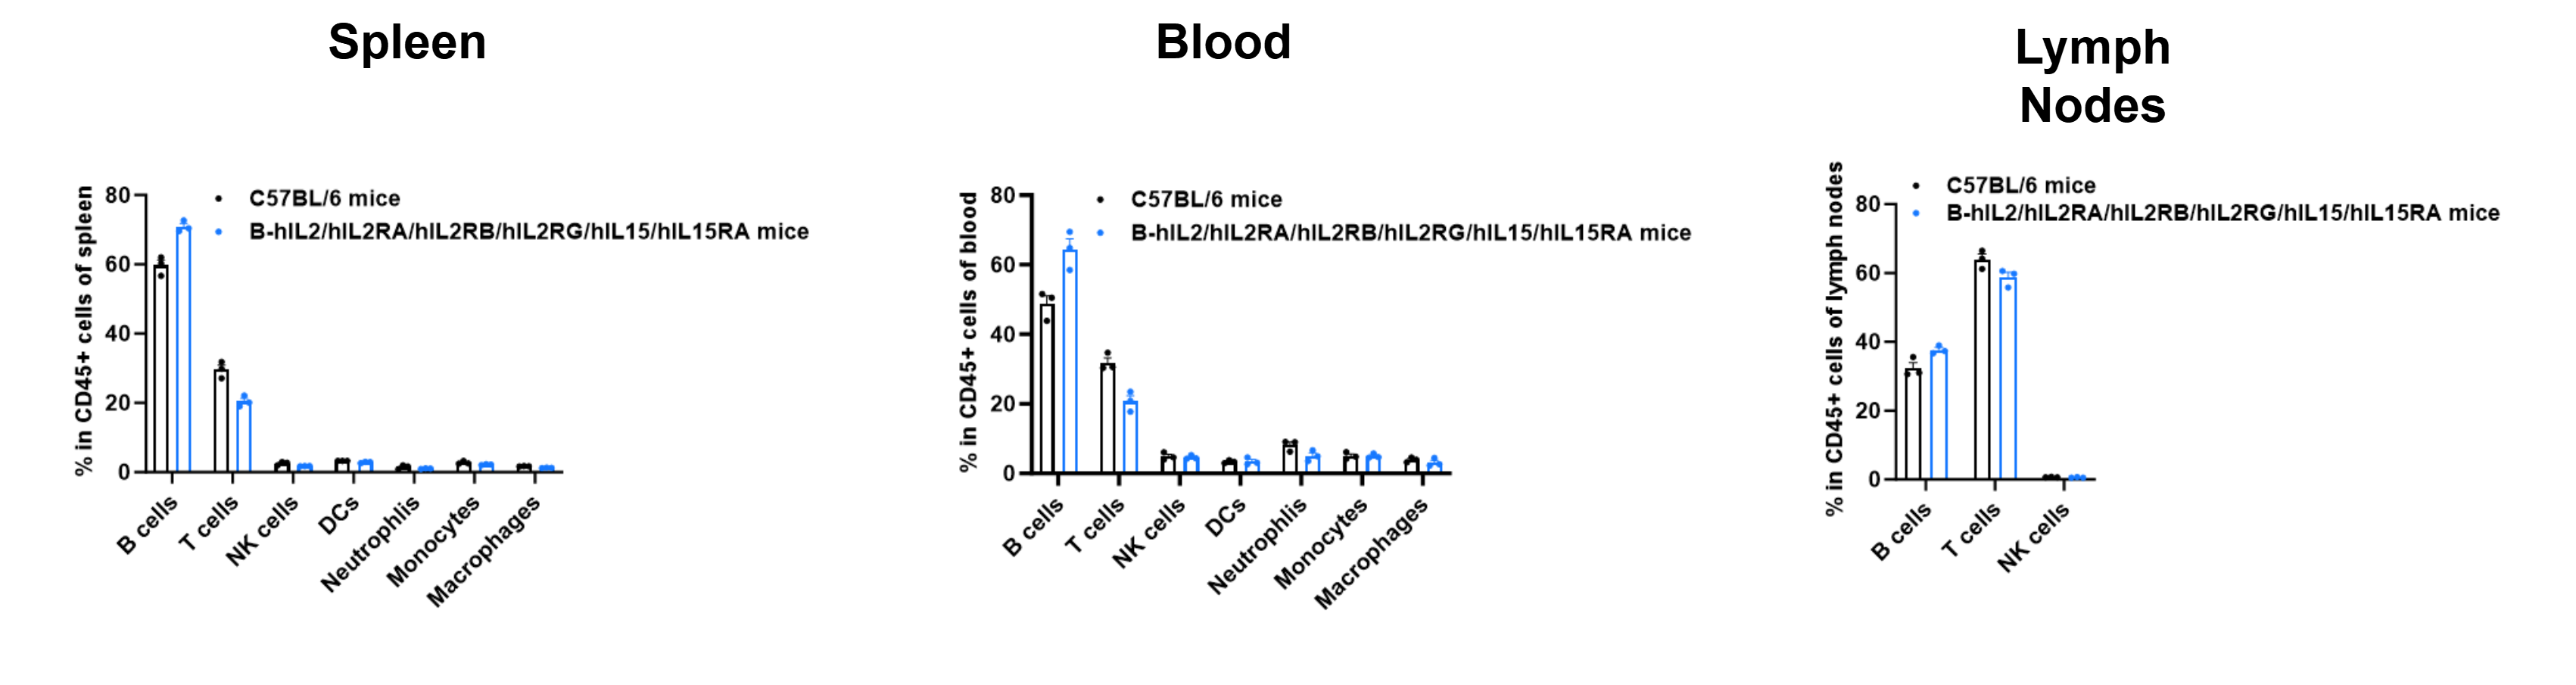
Analysis of leukocyte subpopulations by flow cytometry in immune organs and blood. Splenocytes, peripheral blood, and lymph nodes were isolated from C57BL/6 mice and homozygous B-hIL2/hIL2RA/hIL2RB/hIL2RG/hIL15/hIL15RA mice (female, 6-week-old, n = 3). Single live cells were gated on the CD45⁺ population and analyzed by flow cytometry as indicated. Values are expressed as mean ± SEM.
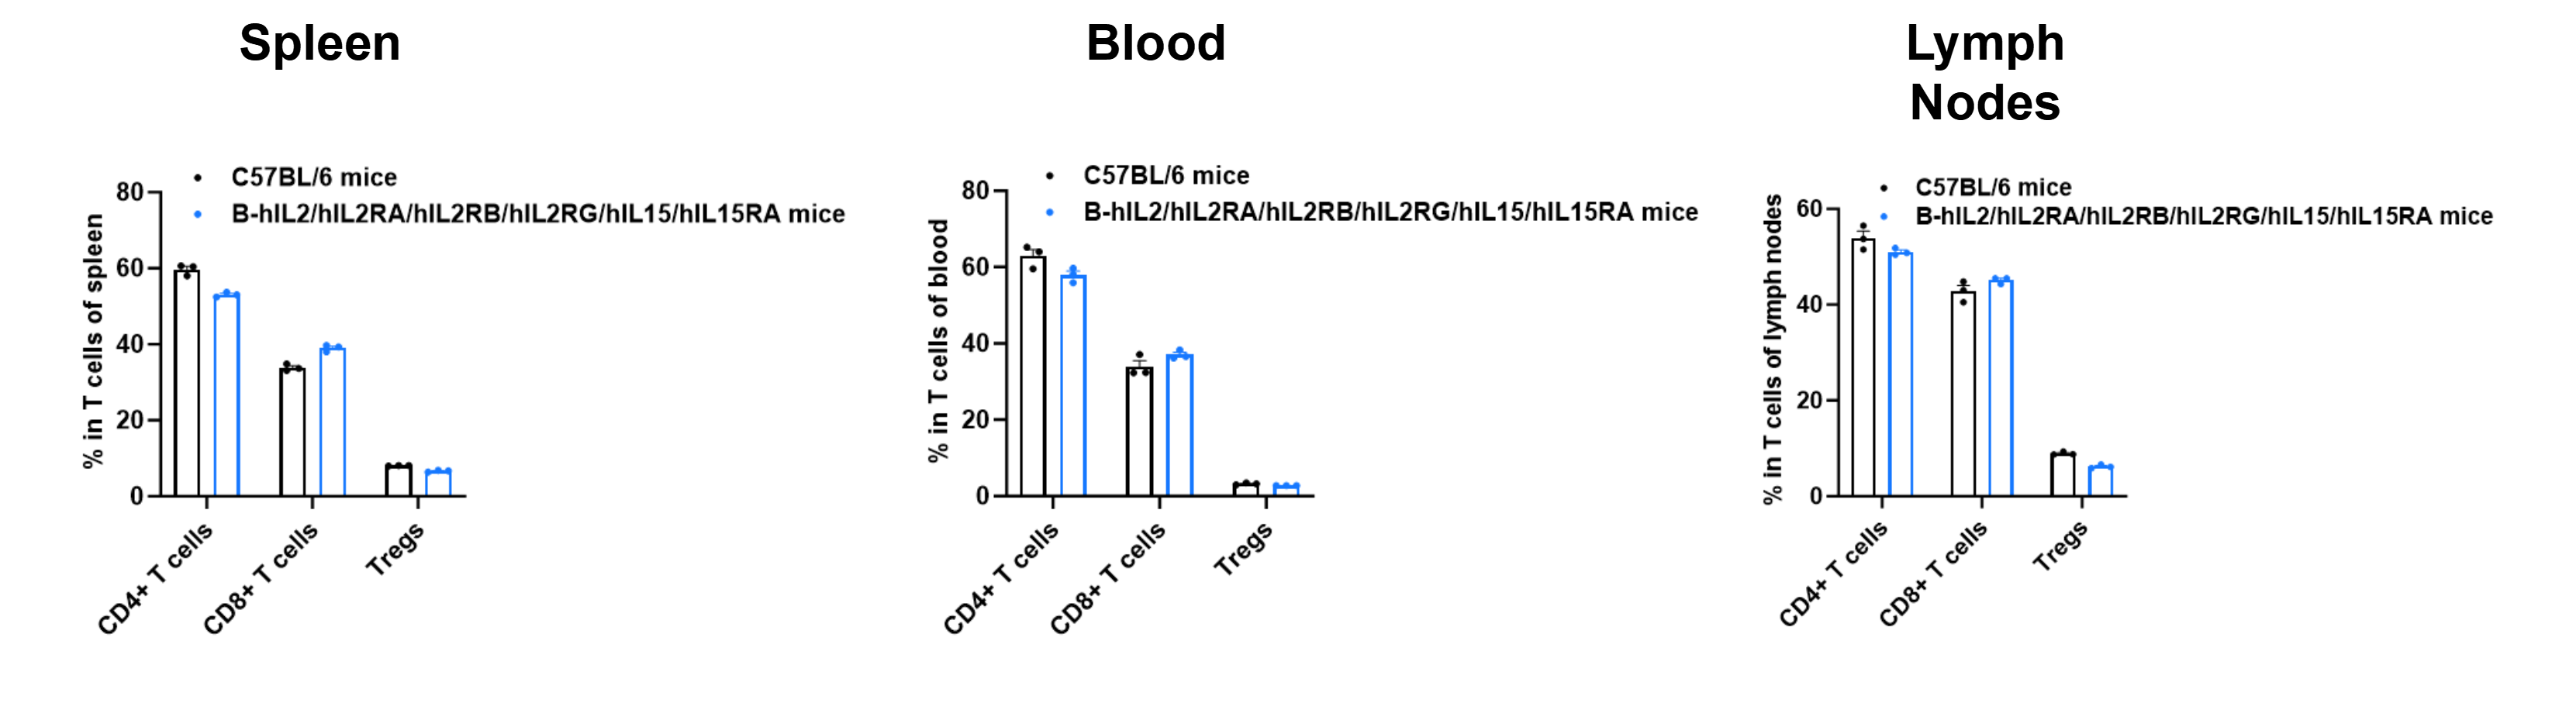
Analysis of T-cell subpopulations by flow cytometry in immune organs and blood. Splenocytes, peripheral blood, and lymph nodes were isolated from C57BL/6 mice and homozygous B-hIL2/hIL2RA/hIL2RB/hIL2RG/hIL15/hIL15RA mice (female, 6-week-old, n = 3). Single live cells were gated on the CD3⁺ T-cell population and analyzed by flow cytometry as indicated. Values are expressed as mean ± SEM.