

C57BL/6N-Trem1tm1(TREM1)Bcgen Pglyrp1tm1(PGLYRP1)Bcgen/Bcgen • 113124

Key Advantages
Validation
Application

In B-hTREM1/hPGLYRP1 mice, mouse Trem1 exons 1-4 encoding the signal peptide and extracellular domain were replaced by human counterparts, while the mouse transmembrane and cytoplasmic regions, promoter, 5’ UTR, and 3’ UTR were retained. Mouse Pglyrp1 exons 1-3 encoding the whole molecule, including the 3’ UTR, were replaced by human counterparts while the mouse promoter and 5’ UTR were retained. This strategy drives human TREM1 and PGLYRP1 expression under endogenous mouse regulatory elements and disrupts mouse Trem1 and Pglyrp1 transcription/translation.

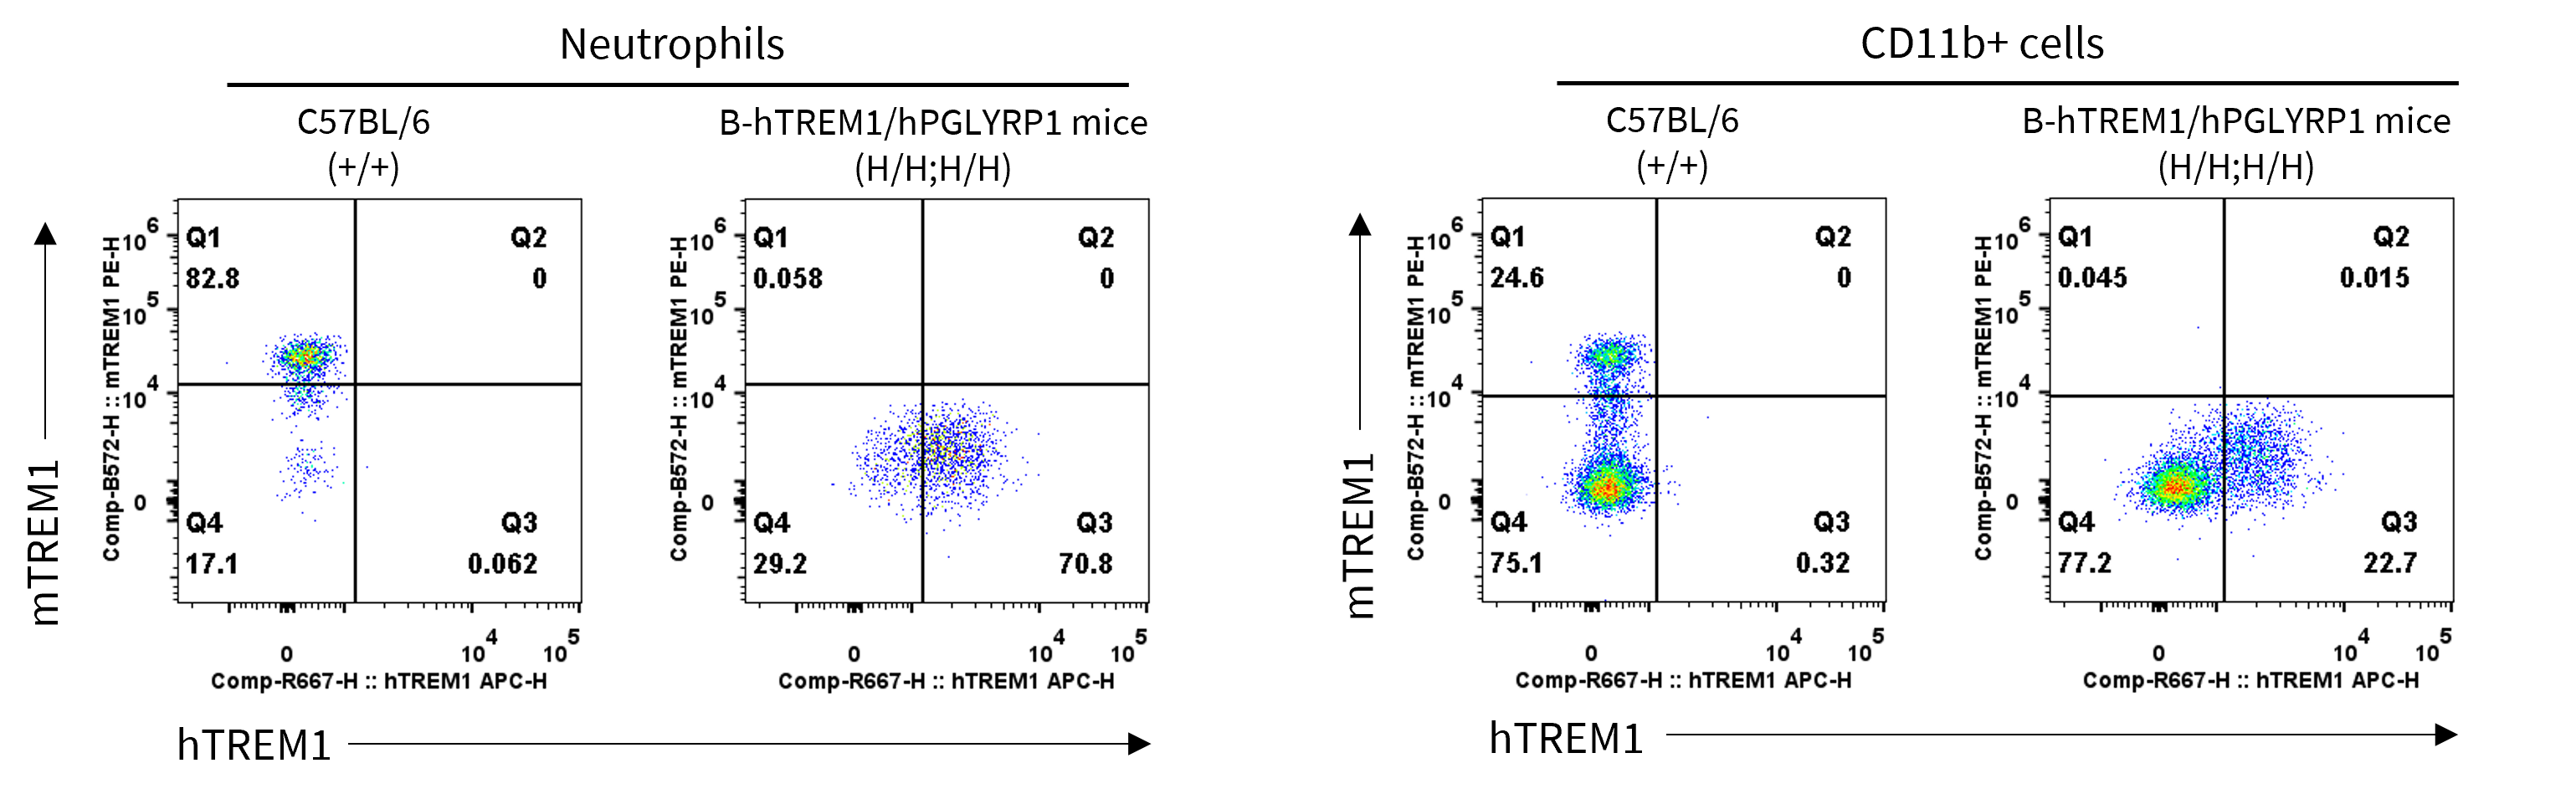
Strain-specific TREM1 expression was analyzed in homozygous B-hTREM1/hPGLYRP1 mice by flow cytometry. Splenocytes were collected from wild-type C57BL/6 mice (+/+) and homozygous B-hTREM1/hPGLYRP1 mice (H/H;H/H), then analyzed with species-specific anti-mouse TREM1 antibody (R&D, FAB1187P) and anti-human TREM1 antibody (BioLegend, 314909). Mouse TREM1 was detectable in neutrophils and CD11b+ cells of wild-type C57BL/6 mice, while human TREM1 was detectable in neutrophils and CD11b+ cells of homozygous B-hTREM1/hPGLYRP1 mice but not in wild-type mice.
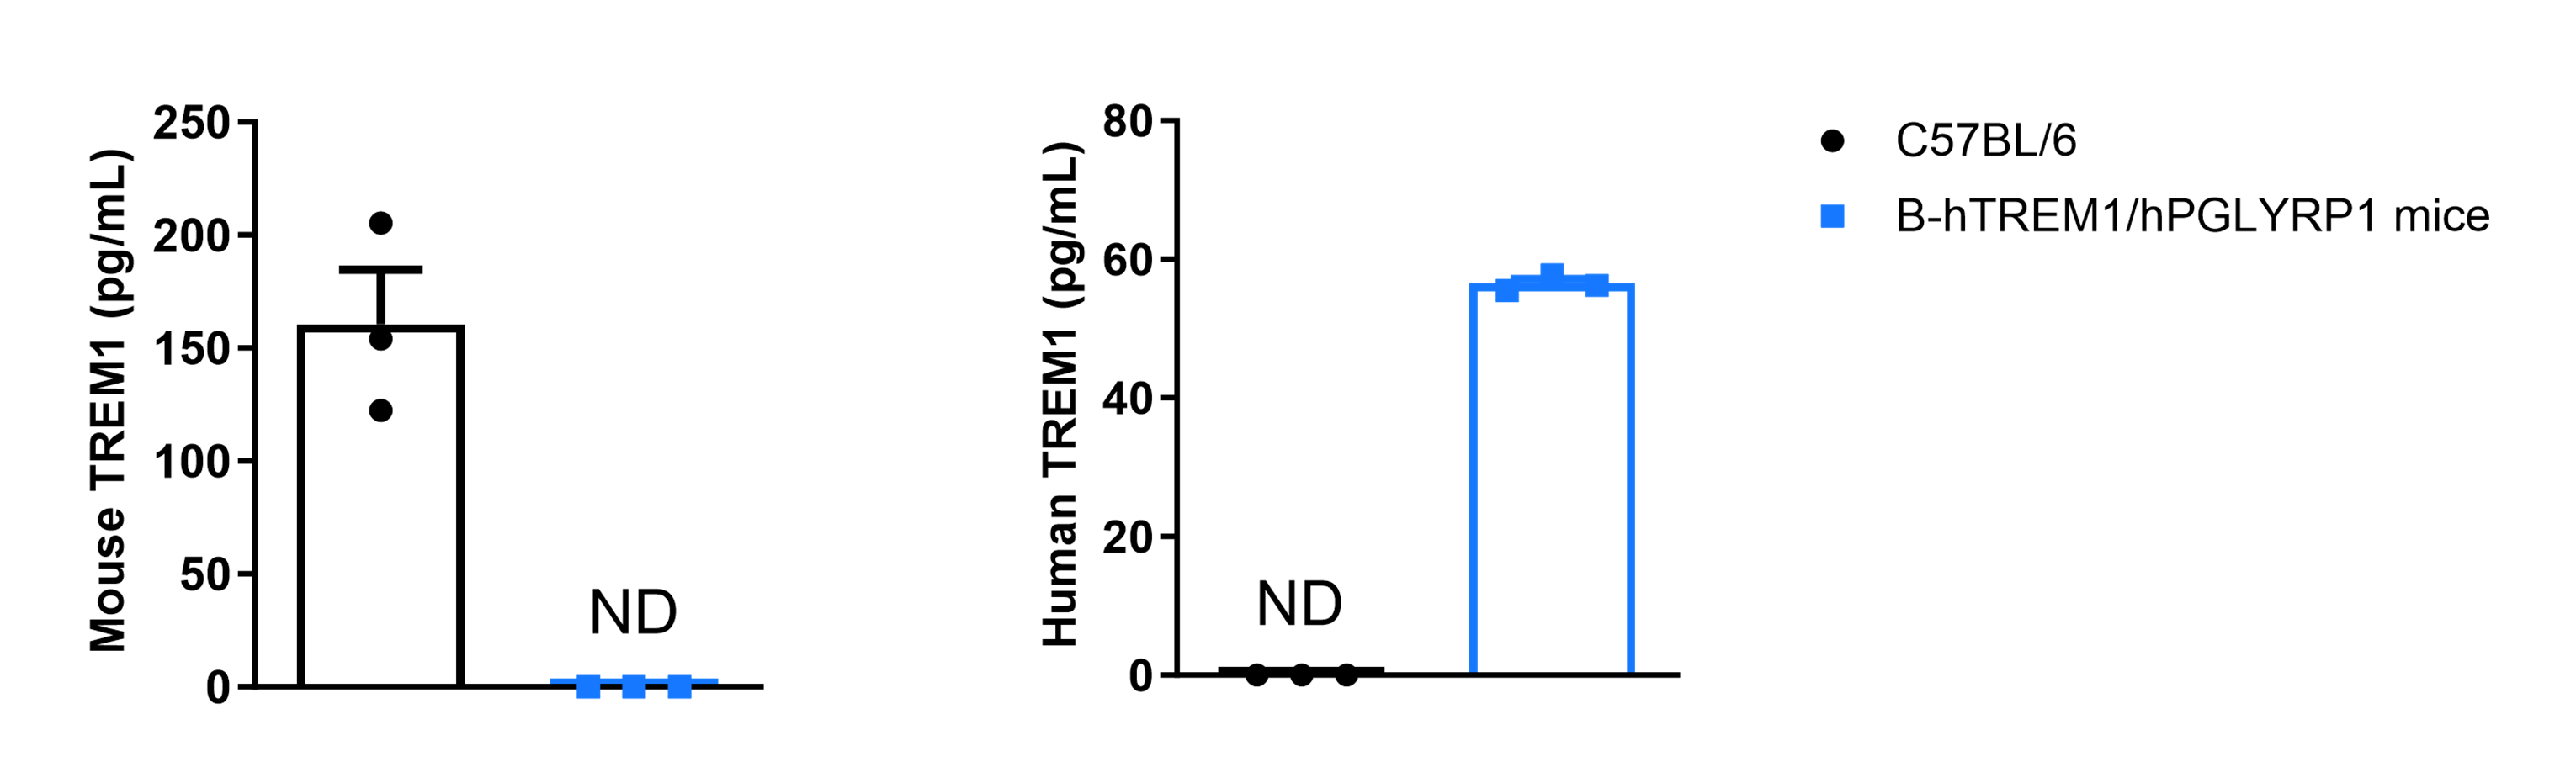
Strain-specific soluble TREM1 expression was analyzed in homozygous B-hTREM1/hPGLYRP1 mice by ELISA. Serum was collected from wild-type C57BL/6 mice (+/+) and homozygous B-hTREM1/hPGLYRP1 mice (H/H;H/H) after in vivo stimulation with 20 μg/mouse LPS for 2 hours. Mouse TREM1 was detectable in wild-type C57BL/6 mice, while human TREM1 was detectable in homozygous B-hTREM1/hPGLYRP1 mice, indicating that mouse matrix metalloproteinase (MMP) can cleave human TREM1 and induce soluble TREM1 release. ND: not detectable.

Strain-specific PGLYRP1 expression was analyzed in homozygous B-hTREM1/hPGLYRP1 mice by ELISA. Serum was collected from wild-type C57BL/6 mice (+/+) and homozygous B-hTREM1/hPGLYRP1 mice (H/H;H/H) with or without LPS stimulation in vivo for 2 hours. Mouse PGLYRP1 was detectable in wild-type C57BL/6 mice, while human PGLYRP1 was detectable in homozygous B-hTREM1/hPGLYRP1 mice.


Experimental schedule of DSS-induced acute colitis in B-hTREM1/hPGLYRP1 mice. Homozygous B-hTREM1/hPGLYRP1 mice were divided into four groups. Normal controls received drinking water for 7 consecutive days, while treatment groups received 3.5% DSS solution for 7 consecutive days.
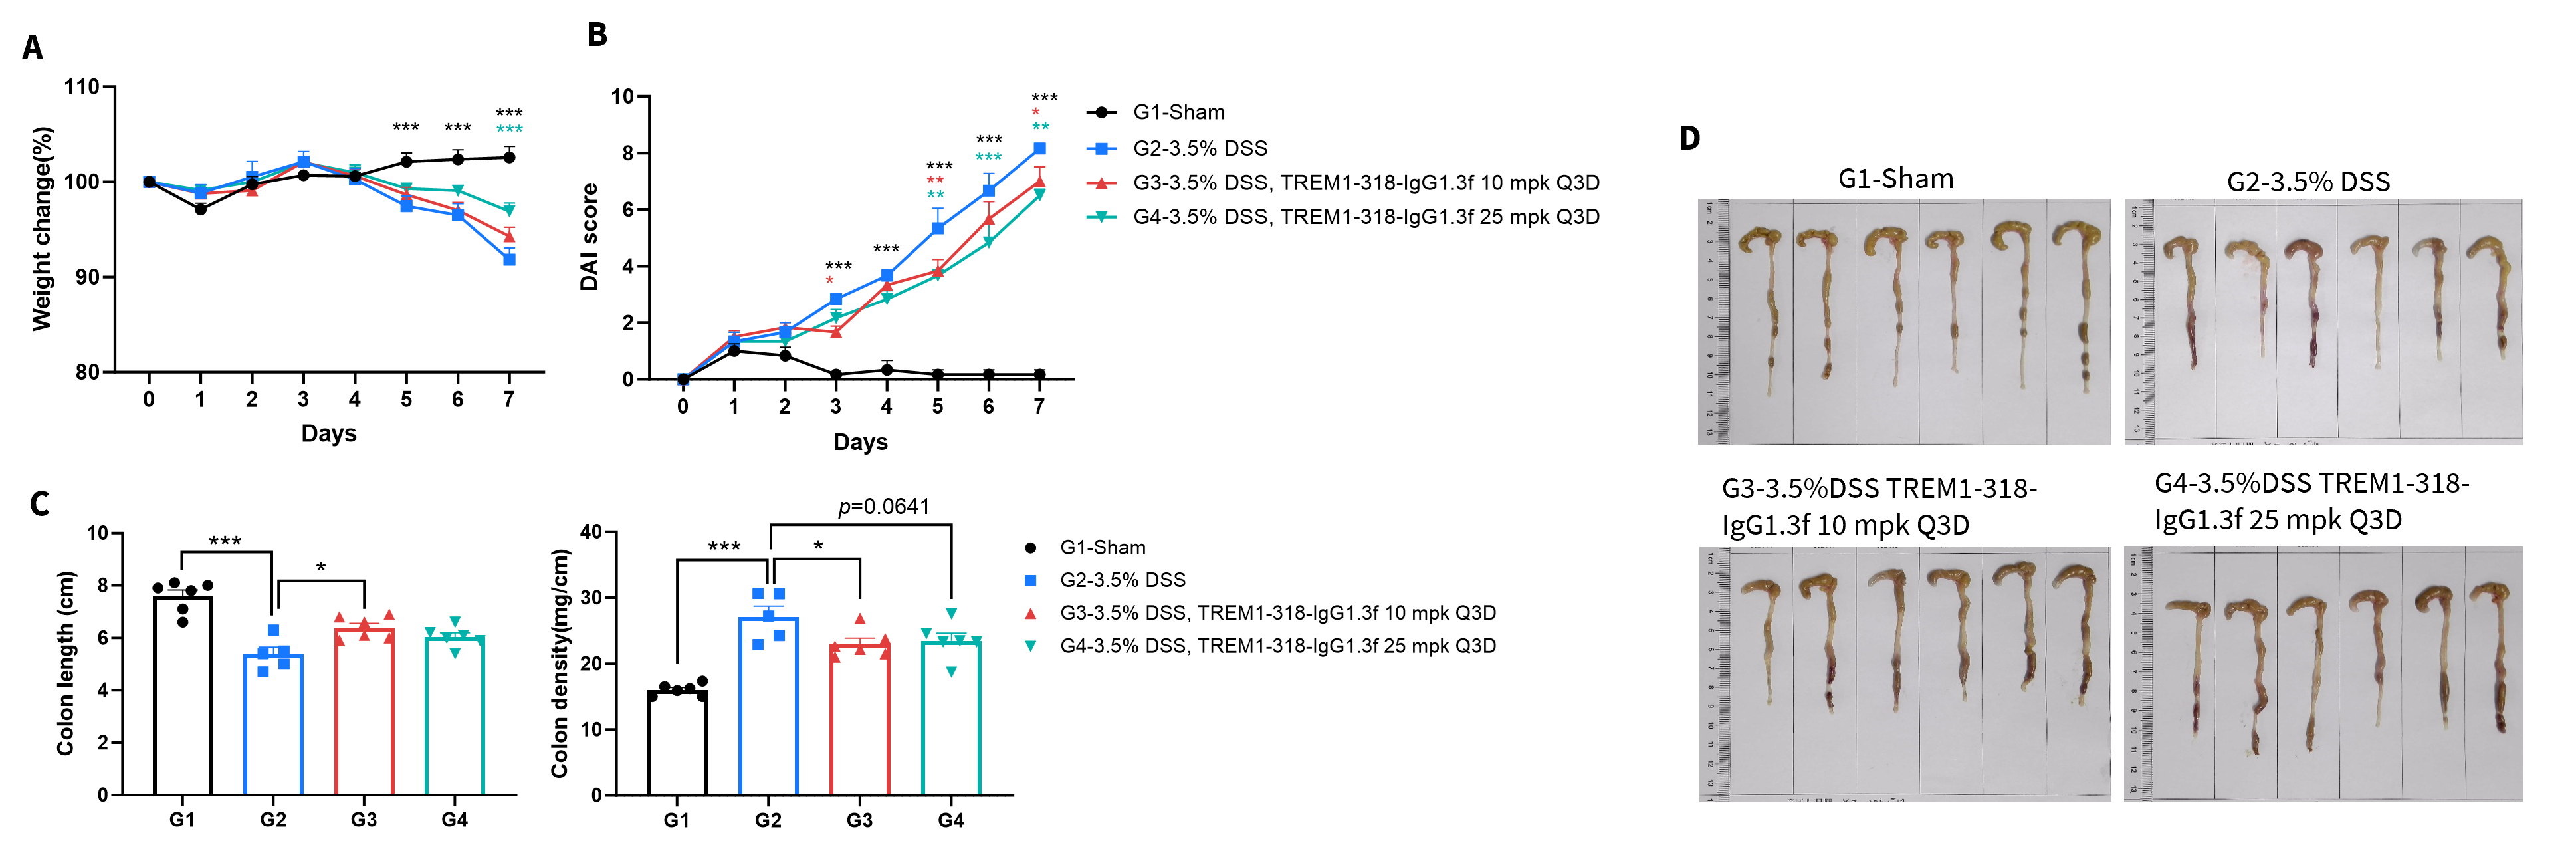
Anti-human TREM1 antibody ameliorates DSS-induced acute colitis in B-hTREM1/hPGLYRP1 mice. B-hTREM1/hPGLYRP1 mice received drinking water, 3.5% DSS, or 3.5% DSS plus TREM1-318-IgG1.3f at 10 or 25 mg/kg Q3D for 7 days. (A) Body weight change. (B) DAI score. (C) Colon length and spleen index. (D) Representative colon images.
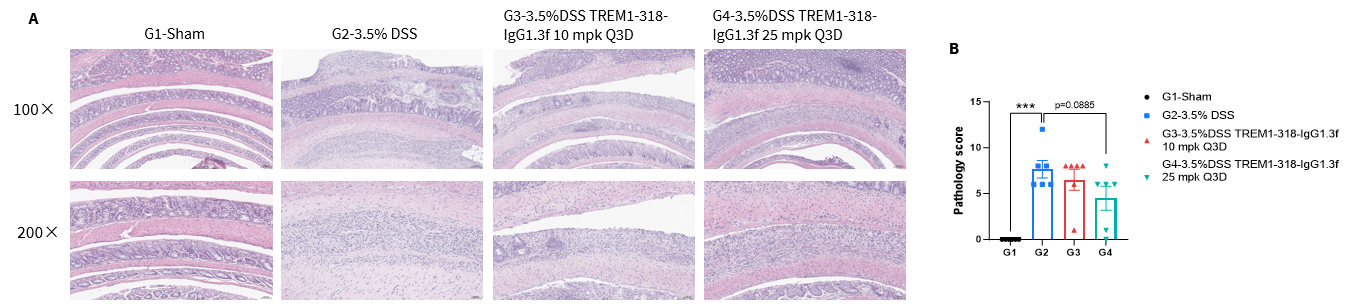
Anti-human TREM1 antibody improves colon histopathology in DSS-induced B-hTREM1/hPGLYRP1 mice. B-hTREM1/hPGLYRP1 mice received 3.5% DSS for 7 days with or without TREM1-318-IgG1.3f at 10 or 25 mg/kg Q3D. (A) Representative H&E-stained colon sections at 100× and 200× magnification. (B) Pathological scores.

Anti-human TREM1 antibody reduces pro-inflammatory cytokines in DSS-induced acute colitis in B-hTREM1/hPGLYRP1 mice. B-hTREM1/hPGLYRP1 mice received 3.5% DSS for 7 days with or without TREM1-318-IgG1.3f at 10 or 25 mg/kg Q3D. Serum IL-6 and TNF-α levels were measured on day 7.

Q1: What are B-hTREM1/hPGLYRP1 mice?
B-hTREM1/hPGLYRP1 mice are TREM1 and PGLYRP1 dual-gene humanized mice on a C57BL/6N background, developed for innate immunity and inflammatory disease research.
Q2: Why are TREM1 and PGLYRP1 important?
TREM1 is an activating myeloid receptor that amplifies inflammatory signaling, while PGLYRP1 is associated with innate immune recognition and inflammatory regulation.
Q3: How was human TREM1 and PGLYRP1 validated in this model?
Human TREM1 was validated by flow cytometry in neutrophils and CD11b+ cells, soluble human TREM1 was validated by ELISA after LPS stimulation, and human PGLYRP1 was validated by ELISA in serum.
Q4: Can B-hTREM1/hPGLYRP1 mice be used for antibody efficacy studies?
Yes. B-hTREM1/hPGLYRP1 mice have in vivo DSS-induced acute colitis efficacy data for anti-human TREM1 antibody treatment.
Q5: What are the main applications of B-hTREM1/hPGLYRP1 mice?
Applications include anti-human TREM1 antibody evaluation, DSS-induced colitis studies, myeloid inflammation research, serum inflammatory-factor analysis, and inflammatory disease drug development.