Description
PD-1/BTLA/HVEM: A multi-checkpoint co-inhibitory network orchestrating T-cell exhaustion and tumor immune evasion.
- Gene Information: PD-1 is a type I transmembrane glycoprotein belonging to the immunoglobulin superfamily and functions as a classic co-inhibitory receptor. BTLA belongs to the immunoglobulin superfamily containing cytoplasmic ITIM/ITSM motifs, while HVEM (TNFRSF14) is a member of the tumor necrosis factor receptor superfamily that operates as a bidirectional molecular switch capable of binding co-inhibitory BTLA and CD160, as well as costimulatory LIGHT.
- Protein Expression: PD-1 is primarily expressed on activated T cells, B cells, and NK cells, with pronounced expression on tumor antigen-specific CD8+ T cells in melanoma. BTLA is prominently co-expressed with PD-1 on tumor antigen-specific CD8+ T cells. HVEM is broadly expressed on melanoma cells, various solid tumor cells, and NK cells. Notably, malignant B-CLL cells aberrantly co-express high levels of HVEM, BTLA, PD-1, and CD160, establishing a distinctive multi-receptor disease phenotype.
- Signaling Mechanism: PD-1 engagement recruits SHP2 and attenuates TCR/CD28 signaling, thereby reducing T-cell effector functions. In trans, tumor-associated HVEM can engage BTLA on neighboring immune cells, delivering inhibitory signals that may promote immune evasion. In cis, HVEM and BTLA co-expressed on the same cell can form a complex that modulates their interactions with ligands and receptors on adjacent cells. Meanwhile, HVEM–LIGHT signaling can regulate immune costimulation and inflammatory responses, including chemokine production.
- Therapeutic Engagement & In Vivo Model: Blocking mAbs targeting PD-1 and BTLA reverse T-cell exhaustion and restore anti-tumor immunity, while HVEM agonists enhance tumor apoptosis. The B-hPD-1/hBTLA/hHVEM mice model serving as an ideal in vivo platform for multi-specific biologics and combination therapies.
Human BTLA Protein Expression Analysis in Spleen of PD-1/BTLA/HVEM Humanized Mice
- Mouse BTLA was only detectable in wild-type C57BL/6 mice, but not in PD-1/BTLA/HVEM humanized mice.
- Human BTLA was exclusively detectable in homozygous PD-1/BTLA/HVEM humanized mice.
Strain specific BTLA expression analysis in wild-type C57BL/6 mice and homozygous PD-1/BTLA/HVEM humanized mice by flow cytometry. Splenocytes were collected from wild-type C57BL/6 mice (+/+) and homozygous B-hPD-1/hBTLA/hHVEM mice (H/H). Protein expression was analyzed with anti-mouse BTLA antibody (Biolegend, 134809) and anti-human BTLA antibody (Biolegend, 344509) by flow cytometry.
Human HVEM Protein Expression Analysis in Spleen of PD-1/BTLA/HVEM Humanized Mice
- Mouse HVEM was only detectable in wild-type C57BL/6 mice, but not in PD-1/BTLA/HVEM humanized mice.
- Human HVEM was exclusively detectable in homozygous PD-1/BTLA/HVEM humanized mice.
Strain specific HVEM expression analysis in wild-type C57BL/6 mice and homozygous PD-1/BTLA/HVEM humanized mice by flow cytometry. Splenocytes were collected from wild-type C57BL/6 mice (+/+) and homozygous B-hPD-1/hBTLA/hHVEM mice (H/H). Protein expression was analyzed with anti-mouse HVEM antibody (Biolegend, 136305) and anti-human HVEM antibody (Biolegend, 318806) by flow cytometry.
Human PD-1 Protein Expression Analysis in Spleen of PD-1/BTLA/HVEM Humanized Mice
- Mouse PD-1 was only detectable in wild-type C57BL/6 mice, but not in PD-1/BTLA/HVEM humanized mice.
- Human PD-1 was exclusively detectable in homozygous PD-1/BTLA/HVEM humanized mice.
Strain specific PD-1 expression analysis in wild-type C57BL/6 mice and homozygous PD-1/BTLA/HVEM humanized mice by flow cytometry. Splenocytes were collected from wild-type C57BL/6 mice (+/+) and homozygous B-hPD-1/hBTLA/hHVEM mice (H/H) stimulated without or with anti-mouse CD3ε antibody (7.5 μg, i.p.) in vivo for 24 hrs. Protein expression was analyzed with anti-mouse PD-1 antibody (Biolegend, 109104) and anti-human PD-1 antibody (Biolegend, 329904) by flow cytometry.
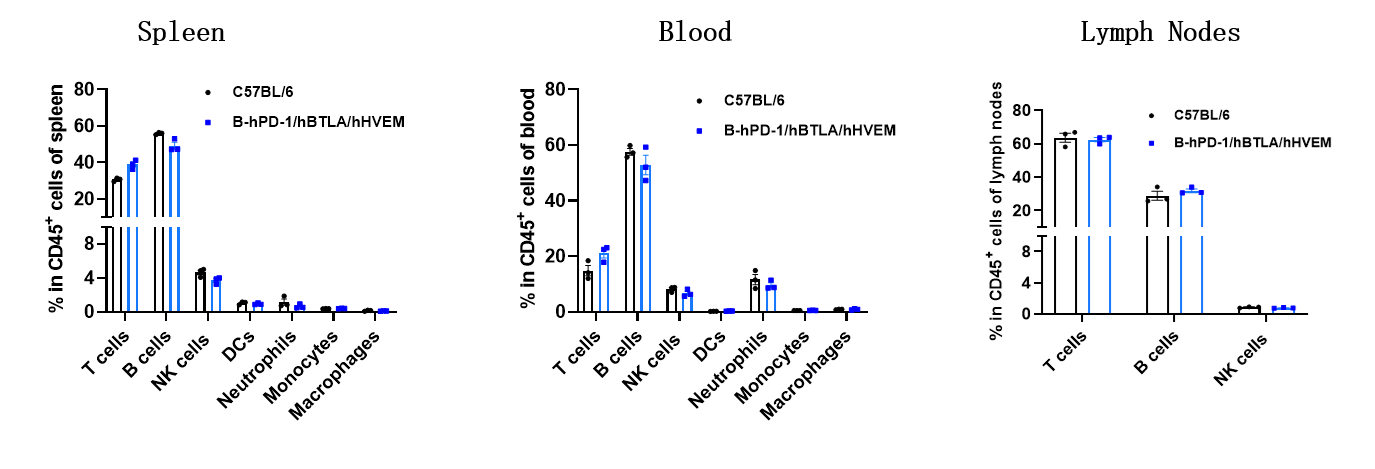
Animal State Evaluation-Leukocyte Profiling in PD-1/BTLA/HVEM Humanized Mice
- The frequencies of T cells, B cells, NK cells, DCs, neutrophils, monocytes, and macrophages in homozygous PD-1/BTLA/HVEM humanized mice were similar to those in C57BL/6 mice.
- Humanization of PD-1, BTLA and HVEM does not affect normal immune cell development or splenic distribution.
Analysis of leukocyte subpopulations by flow cytometry in immune organs and blood. Splenocytes, peripheral blood and lymph nodes were isolated from C57BL/6 and B-hPD-1/hBTLA/hHVEM mice (female, 7-week-old, n = 3). Single live cells were gated on the CD45⁺ population and analyzed by flow cytometry as indicated. Values are expressed as mean ± SEM.
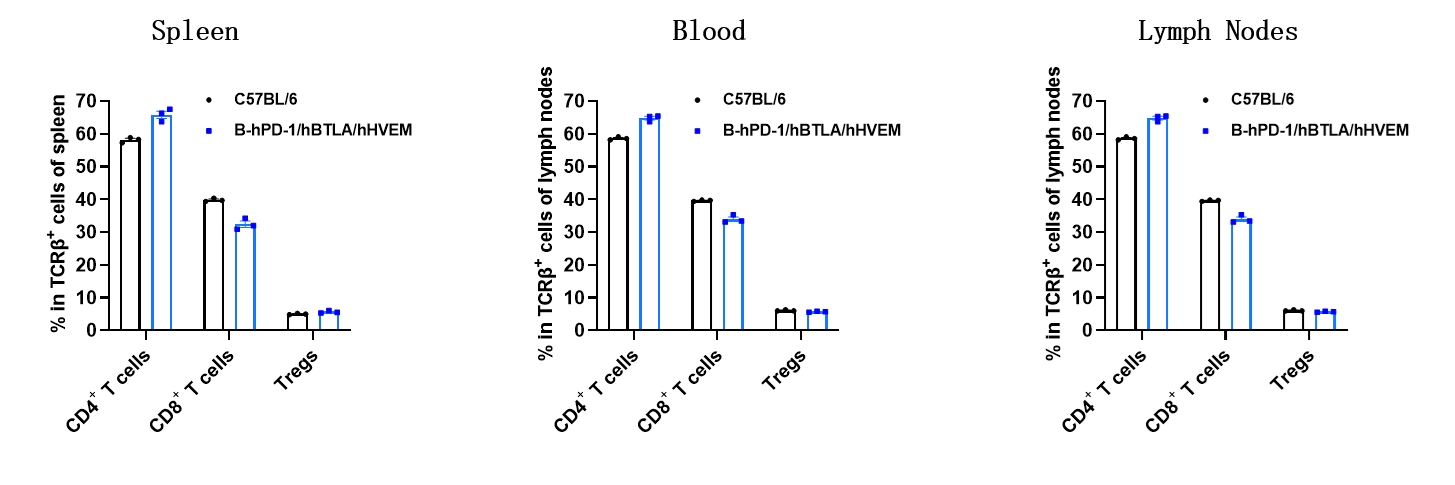
Animal State Evaluation-T Cell Subpopulations in PD-1/BTLA/HVEM Humanized Mice
- The proportions of CD4⁺ T cells, CD8⁺ T cells, and Tregs in homozygous PD-1/BTLA/HVEM humanized mice were comparable to those in C57BL/6 mice.
- Humanization of of PD-1, BTLA and HVEM does not affect normal T cell development, differentiation, or splenic distribution.
Analysis of T-cell subpopulations by flow cytometry in immune organs and blood. Splenocytes, peripheral blood and lymph nodes were isolated from C57BL/6 and B-hPD-1/hBTLA/hHVEM mice (female, 7-week-old, n = 3). Single live cells were gated on the TCRβ⁺ T-cell population and analyzed by flow cytometry as indicated. Values are expressed as mean ± SEM.
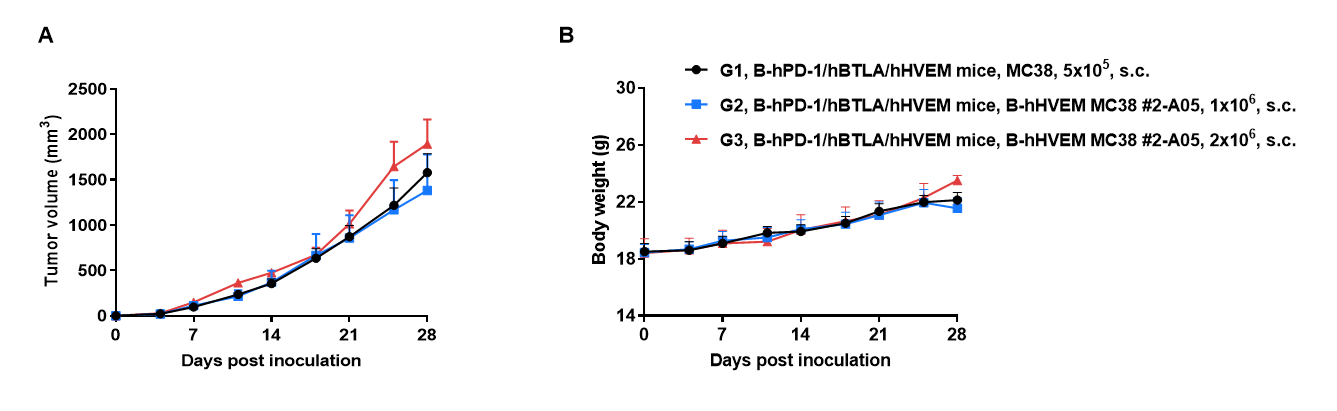
Tumor Growth Curve & Body Weight Changes in PD-1/BTLA/HVEM Humanized Mice
Subcutaneous tumor growth of B-hHVEM MC38 cells. B-hHVEM MC38 cells (1x10⁶, 2x10⁶) and wild-type MC38 cells (5x10⁵) were subcutaneously implanted into homozygous B-hPD-1/hBTLA/hHVEM mice (female, 6-week-old, n=5). Tumor volume and body weight were measured twice a week. (A) Average tumor volume. (B) Body weight. Volume was expressed in mm3 using the formula: V=0.5 x long diameter x short diameter2. Results indicate that B-hHVEM MC38 cells were able to establish tumors in vivo and can be used for efficacy studies. Values are expressed as mean ± SEM.
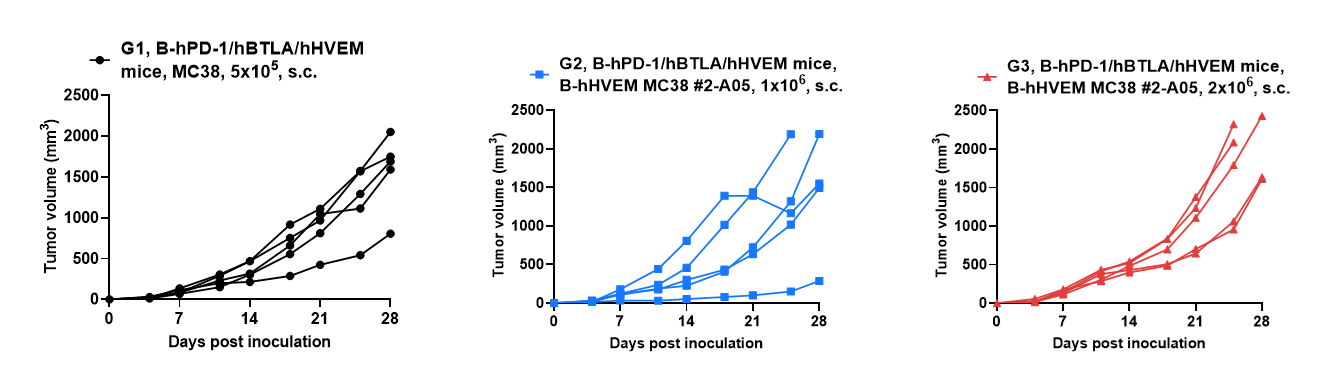
Tumor Growth Curves of Individual Mouse in PD-1/BTLA/HVEM Humanized Mice
B-hHVEM MC38 tumor growth curves from individual mice. B-hHVEM MC38 cells (1x10⁶, 2x10⁶) and wild-type MC38 cells (5x10⁵) were subcutaneously implanted into homozygous B-hPD-1/hBTLA/hHVEM mice (female, 6-week-old, n=5). Results indicate that B-hHVEM MC38 cells were able to establish tumors in vivo and can be used for efficacy studies. Values are expressed as mean ± SEM.
* When publishing results obtained using this animal model, please acknowledge the source as follows: The animal model [B-hPD-1/hBTLA/hHVEM mice] (Cat# 113166) was purchased from Biocytogen.