

CD3EDG: Signaling in Tregs for Mechanism and Therapeutic Potential
Targeting the TRAC/TRBC1/TRBC2: Biological Roles and Therapeutic Strategies

CD3EDG
TRAC
TRBC1/TRBC2

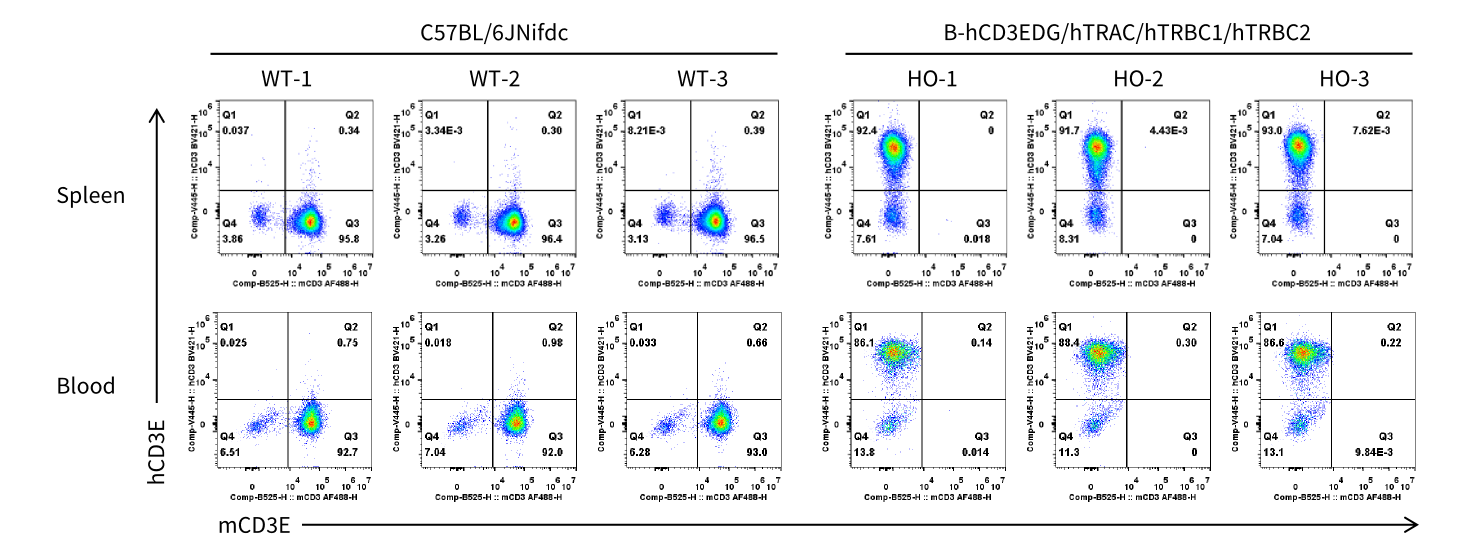
Strain specific CD3E expression analysis in homozygous B-hCD3EDG/hTRAC/hTRBC1/hTRBC2 mice by flow cytometry. Splenocytes and blood cells were collected from wild-type (WT) C57BL/6JNifdc mice and homozygous (HO) B-hCD3EDG/hTRAC/hTRBC1/hTRBC2 mice (male, 10-week-old, n=3).Protein expression was analyzed with anti-mouse CD3 antibody (Biolegend, 100312) and anti-humanCD3 antibody (BD, 556612) by flow cytometry.
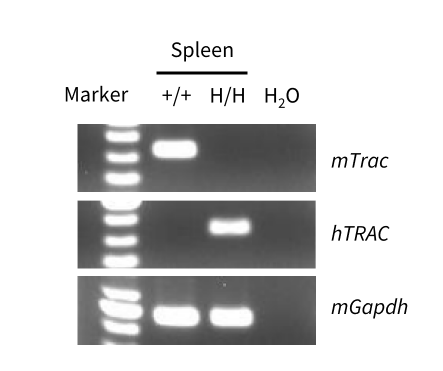
Strain specific analysis of TRAC mRNA expression in wild-type C57BL/6JNifdc mice and B-hCD3EDG/hTRAC/hTRBC1/hTRBC2 mice by RT-PCR. Spleen RNA was isolated from wild-type C57BL/6JNifdc mice (+/+) and homozygous B-hCD3EDG/hTRAC/hTRBC1/hTRBC2 mice (H/H), and then cDNA libraries were synthesized by reverse transcription, followed by PCR with mouse or human TRAC primers.
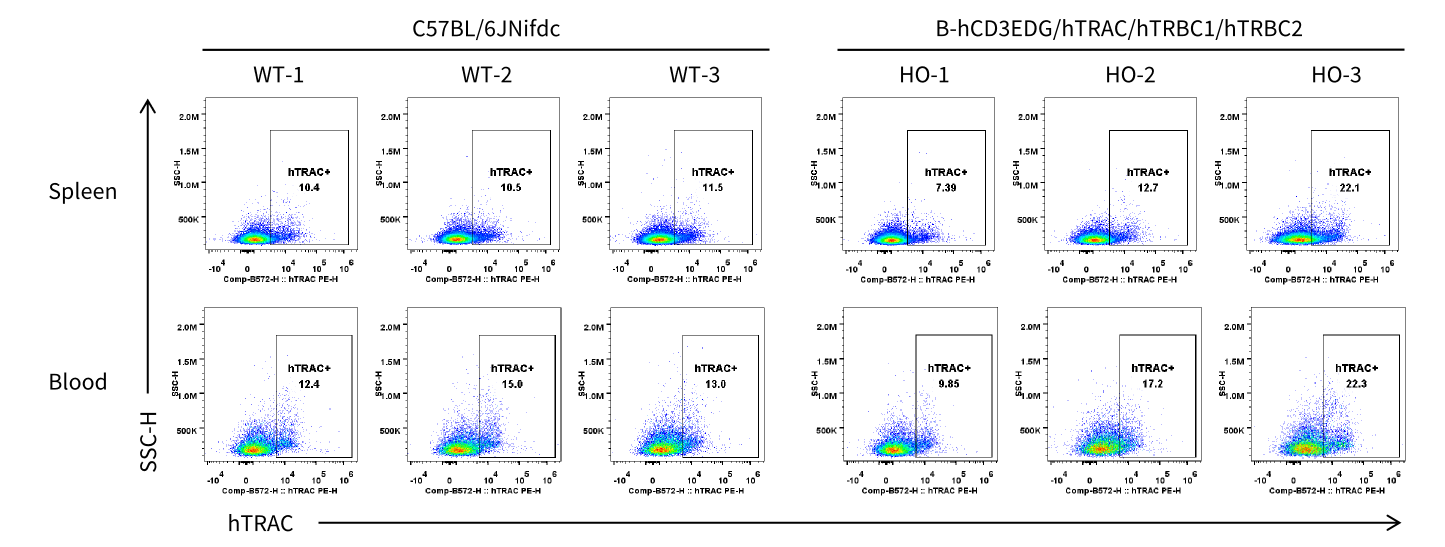
Strain specific TRAC expression analysis in homozygous B-hCD3EDG/hTRAC/hTRBC1/hTRBC2 mice by flow cytometry. Splenocytes and blood cells were collected from wild-type (WT) C57BL/6JNifdc mice and homozygous (HO) B-hCD3EDG/hTRAC/hTRBC1/hTRBC2 mice (male, 10-week-old, n=3).TRAC expression was analyzed by flow cytometry using anti- TRAC antibody (Invitrogen, PA5-95587).
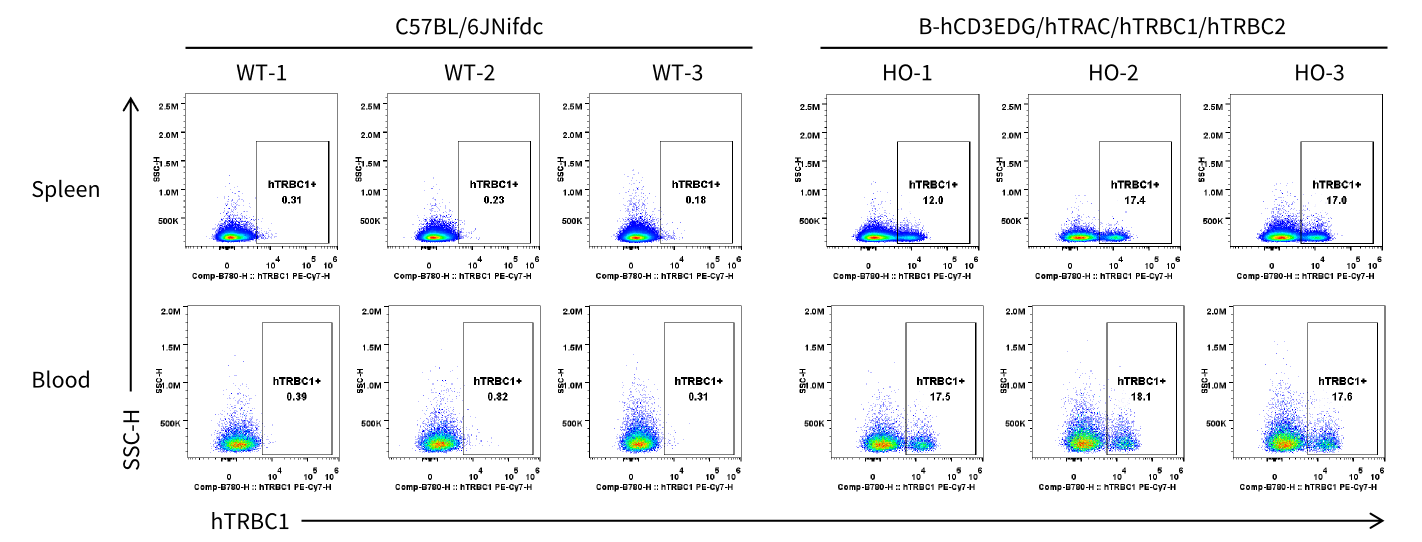
Strain specific TRBC1 expression analysis in homozygous B-hCD3EDG/hTRAC/hTRBC1/hTRBC2 mice by flow cytometry. Splenocytes and blood cells were collected from wild-type (WT) C57BL/6JNifdc mice and homozygous (HO) B-hCD3EDG/hTRAC/hTRBC1/hTRBC2 mice (male, 10-week-old, n=3).TRBC1 expression was analyzed by flow cytometry using anti-human TRBC1 antibody (Biolegend, 383515).
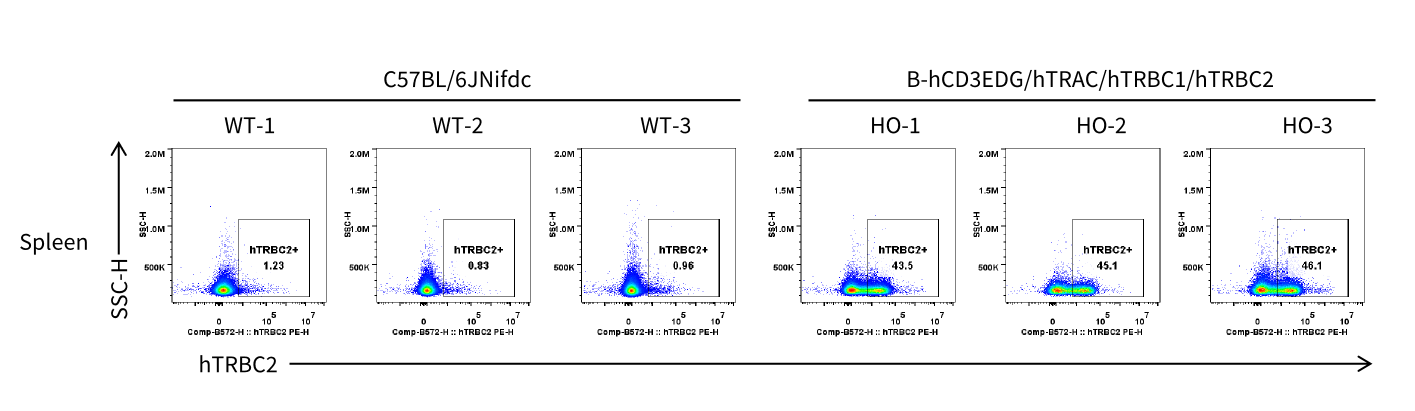
Strain specific TRBC2 expression analysis in homozygous B-hCD3EDG/hTRAC/hTRBC1/hTRBC2 mice by flow cytometry. Splenocytes were collected from wild-type (WT) C57BL/6JNifdc mice and homozygous (HO) B-hCD3EDG/hTRAC/hTRBC1/hTRBC2 mice (male, 10-week-old, n=3). TRBC2 expression was analyzed by flow cytometry using anti-human TRBC2 antibody (BD, 571191).
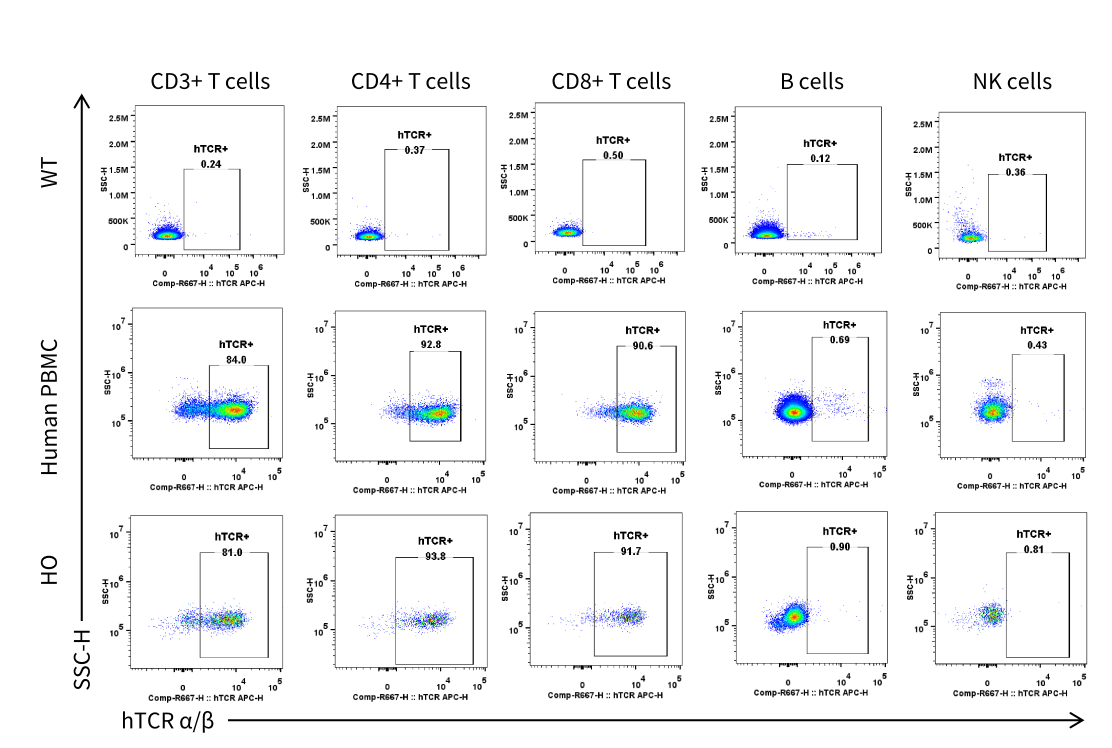
Strain-specific TCR α/β expression analysis in homozygous B-hCD3EDG/hTRAC/hTRBC1/hTRBC2 mice by flow cytometry. Splenocytes were collected from wild-type (WT) C57BL/6JNifdc mice and homozygous (HO) B-hCD3EDG/hTRAC/hTRBC1/hTRBC2 mice (male, 10-week-old, n = 1). TCR α/β expression was analyzed by flow cytometry using anti-human TCR α/β antibody (BioLegend, 306717).
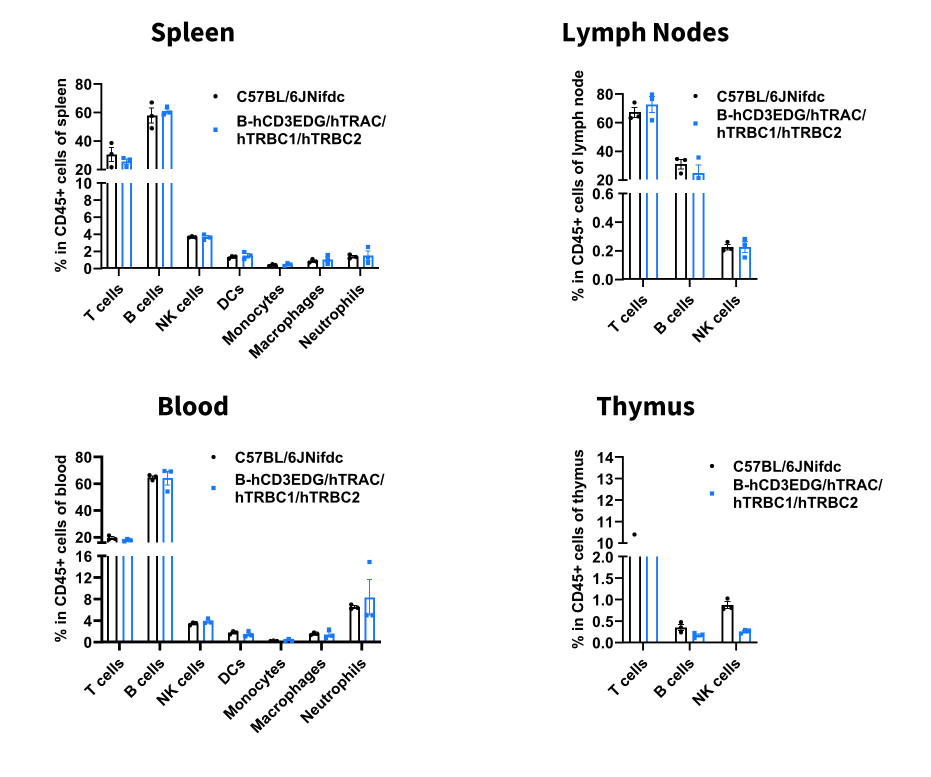
Analysis of leukocyte subpopulations by flow cytometry in immune organs and blood. Splenocytes, peripheral blood, lymph nodes and thymus were isolated from male C57BL/6JNifdc and B-hCD3EDG/hTRAC/hTRBC1/hTRBC2 mice (male, n = 3, 10-week-old). Single live cells were gated on the CD45⁺ population and analyzed by flow cytometry as indicated. Values are expressed as mean ± SEM.
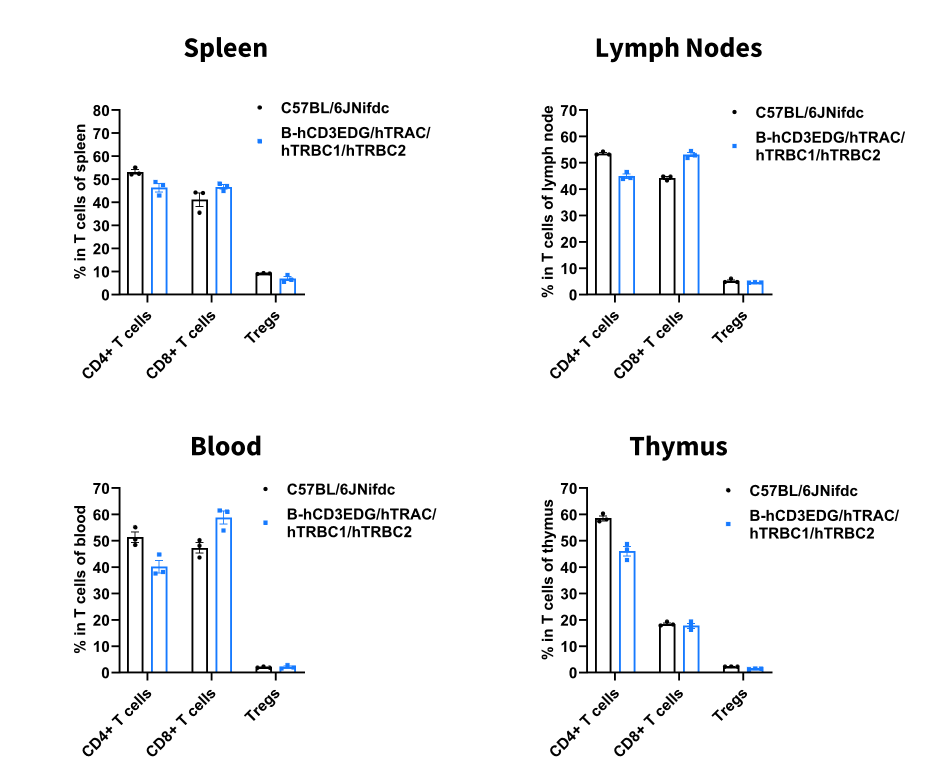
Analysis of T-cell subpopulations by flow cytometry in immune organs and blood. Splenocytes, peripheral blood, lymph nodes and thymus were isolated from male C57BL/6JNifdc and B-hCD3EDG/hTRAC/hTRBC1/hTRBC2 mice (male, n = 3, 10-week-old). Single live cells were gated on the CD3⁺ T-cell population and analyzed by flow cytometry as indicated. Values are expressed as mean ± SEM.
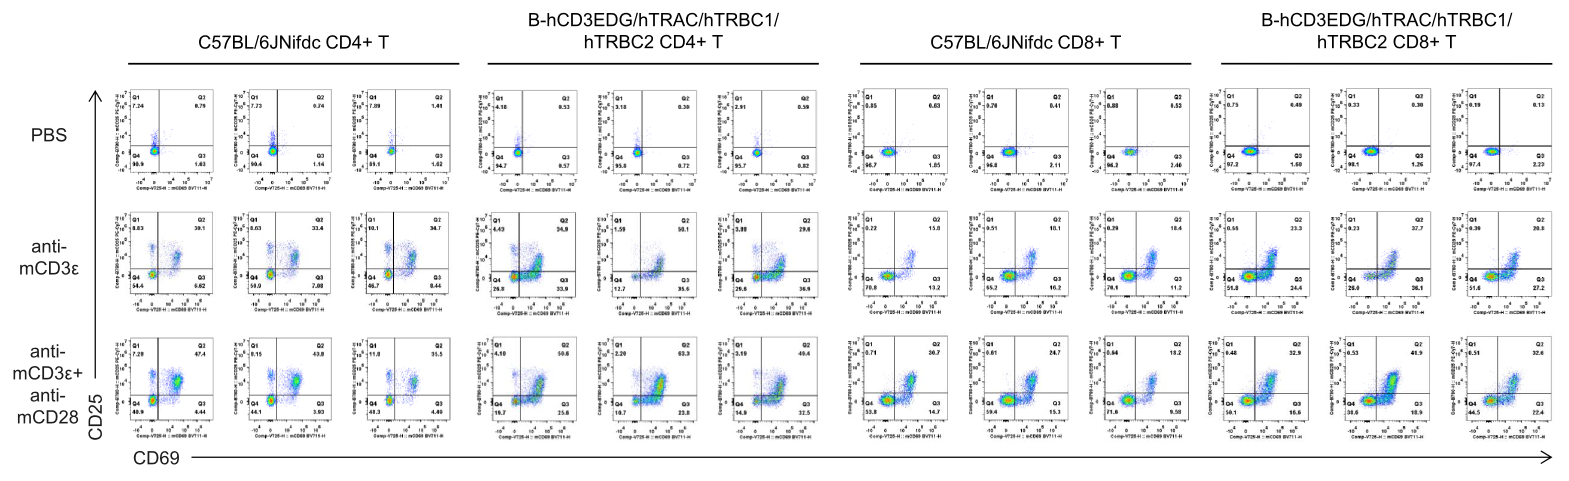
In vitro T cell activation by anti-mCD3ε antibody with or without anti-mCD28 antibody in wild-type C57BL/6JNifdc mice and homozygous humanized B-hCD3EDG/hCD8/hTRAC/hTRBC1/hTRBC2 mice (24h). T cells were isolated from splenocytes of C57BL/6JNifdc (male, 9-week-old, n = 3) and B-hCD3EDG/hCD8/hTRAC/hTRBC1/hTRBC2 mice (male, 9-week-old, n = 2), and incubated in the presence of anti-mCD3ε antibody (2 ug/ml, BioXcell, BE0001-2), with or witnout anti-mCD28 antibody (5 ug/ml, BioXcell, BE0015-1) for 24h.
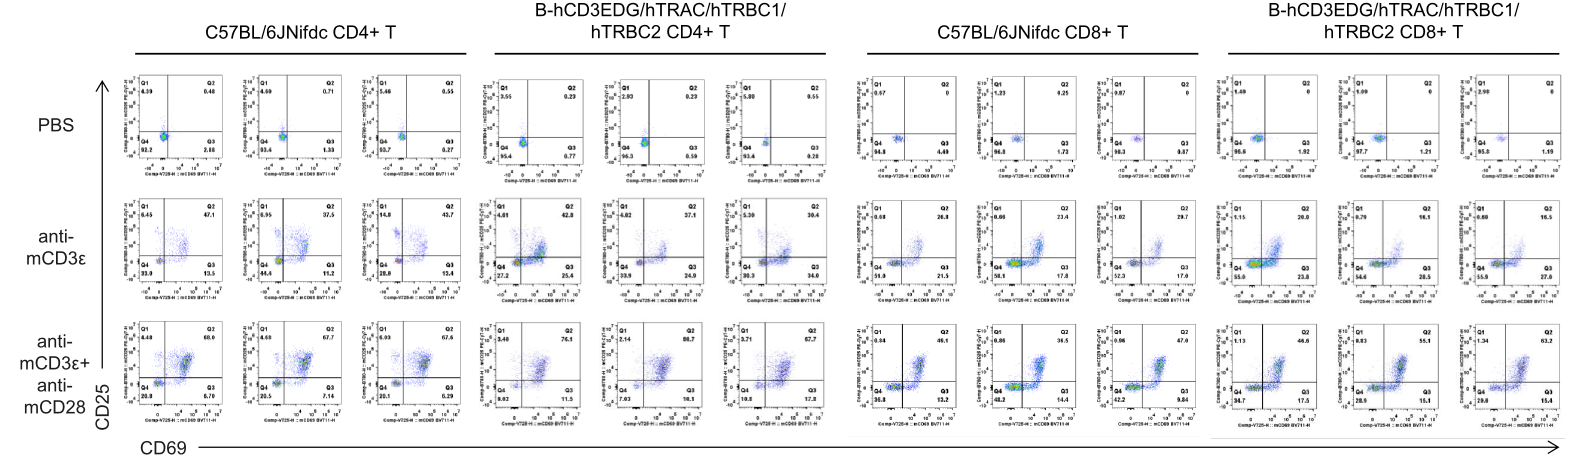
In vitro T cell activation by anti-mCD3ε antibody with or without anti-mCD28 antibody in wild-type C57BL/6JNifdc mice and homozygous humanized B-hCD3EDG/hCD8/hTRAC/hTRBC1/hTRBC2 mice (48h). T cells were isolated from splenocytes of C57BL/6JNifdc (male, 9-week-old, n = 3) and B-hCD3EDG/hCD8/hTRAC/hTRBC1/hTRBC2 mice (male, 9-week-old, n = 2), and incubated in the presence of anti-mCD3ε antibody (2 ug/ml, BioXcell, BE0001-2), with or witnout anti-mCD28 antibody (5 ug/ml, BioXcell, BE0015-1) for 48h.