


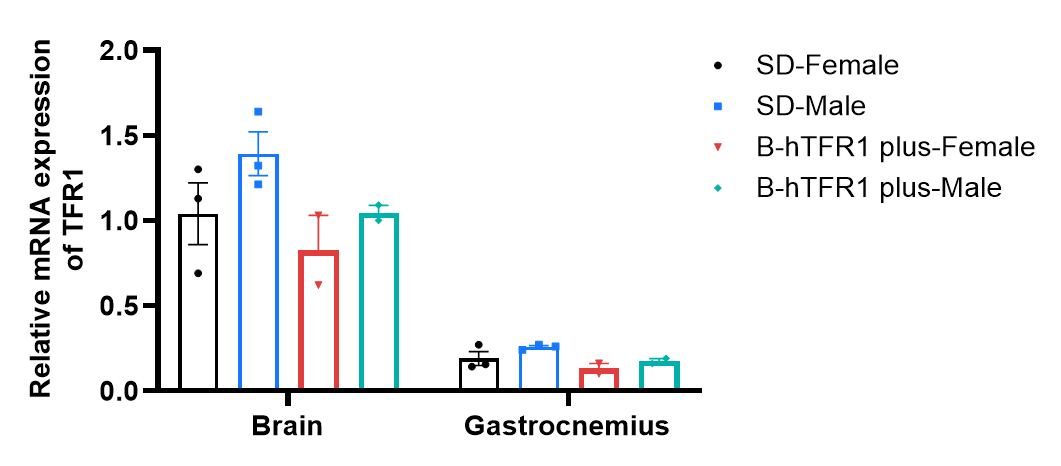
Species specific analysis of TFR1 gene expression in wild-type SD rats and homozygous TFR1 humanized rats by RT-qPCR. Brain and gastrocnemius were collected from wild-type SD rats (+/+) (female/male, n=3, 7-week-old) and homozygous B-hTFR1 rats plus (H/H) (female, n=2; male, n=2, 13-week-old). Data are presented as the mean ± SEM.
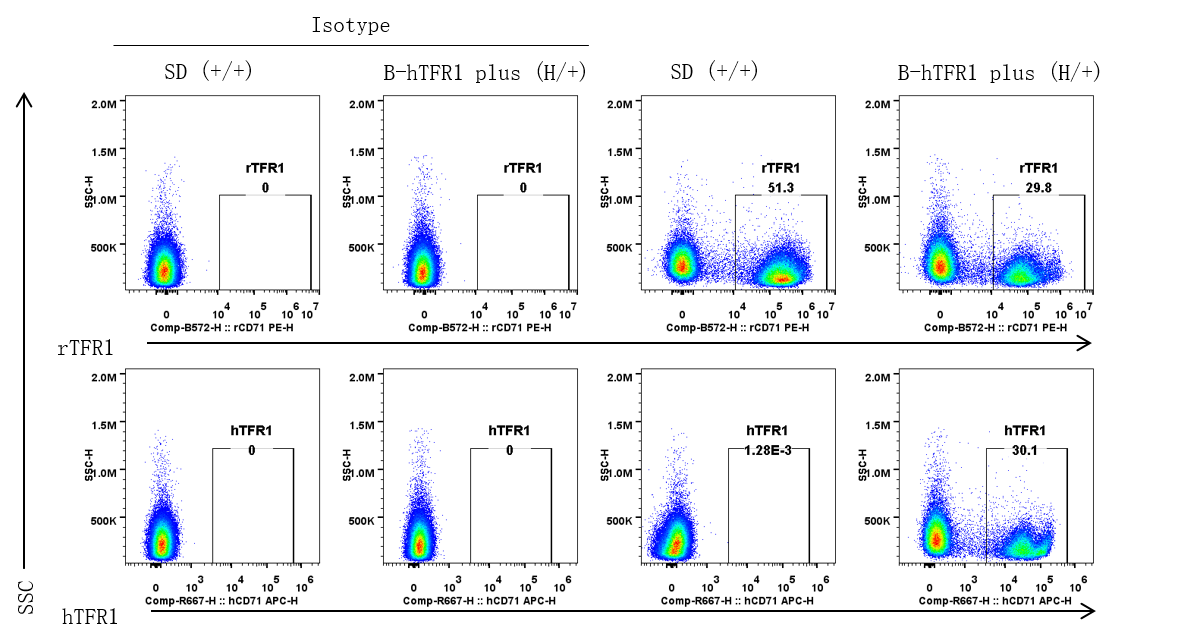
Strain specific TFR1 expression analysis in heterozygous TFR1 humanized rats by flow cytometry. Bone marrow was collected from wild-type SD rats (+/+) and heterozygous B-hTFR1 rats plus (H/+) (male, 6-week-old). Protein expression was analyzed with anti-rat TFR1 antibody (Biolegend, 204410) and anti-human TFR1 antibody (Biolegend, 334108) by flow cytometry in bone marrow erythrocytes.
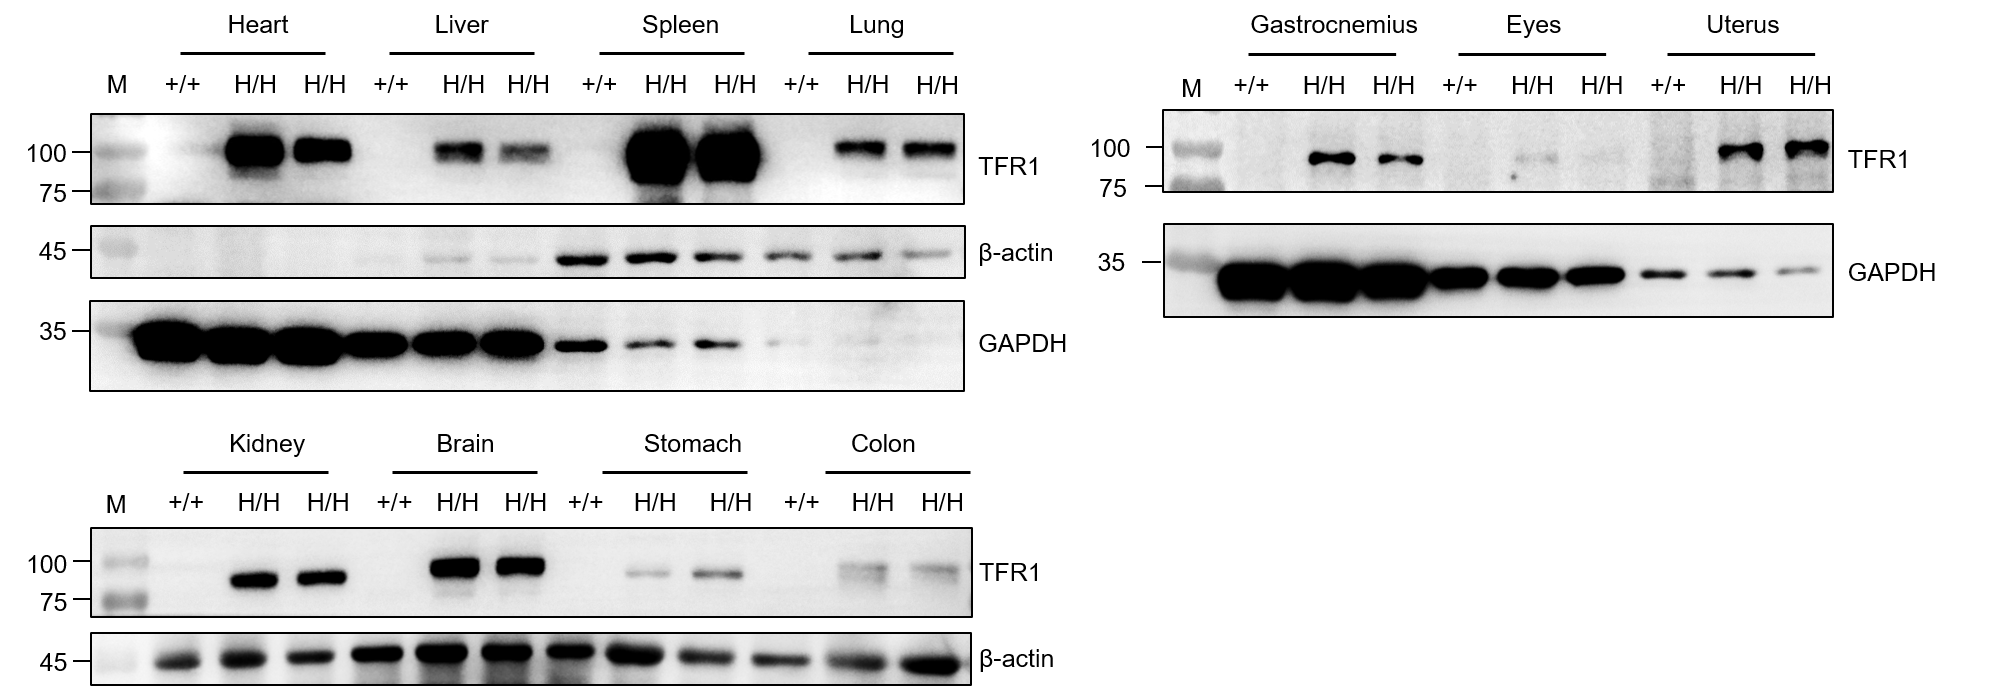
Western blot analysis of TFR1 protein expression in homozygous TFR1 humanized rats . Various tissue lysates were collected from SD rats (+/+) (1 male, 13-week-old) and homozygous B-hTFR1 rats plus (H/H) (1 male, 1 female, 13-week-old), and then analyzed by western blot with species-specific anti-TFR1 antibody (Abcam, ab214039). 40 μg total proteins were loaded for western blotting analysis.
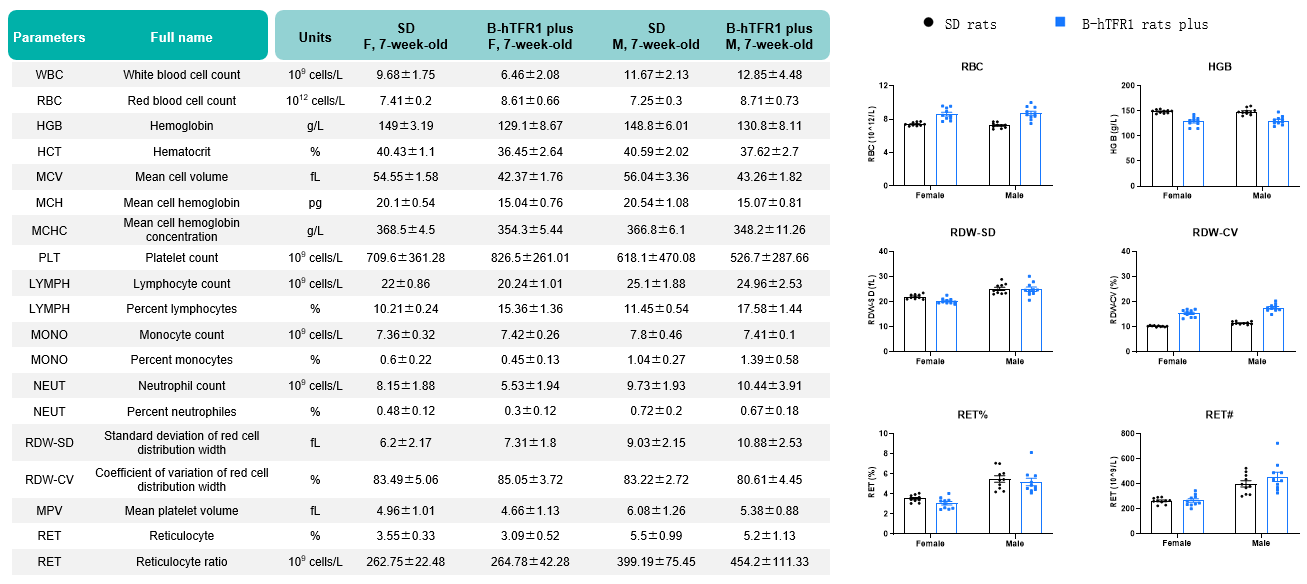
Values are expressed as mean ± SD.
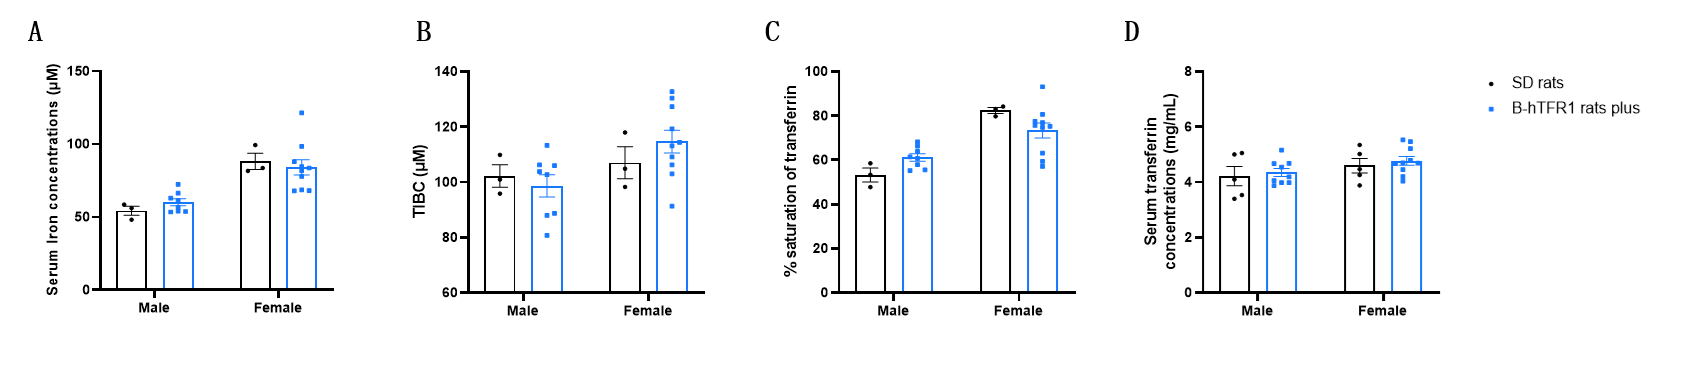
Serum iron homeostasis assay in wild-type SD rats and homozygous humanized TFR1 humanized rats. Serum was collected from SD rats (female, n=3; male, n=3, 9-week-old) and homozygous humanized B-hTFR1 rats plus (female, n=10; male, n=10, 9-week-old), and then analyzed by Total Iron-Binding Capacity (TIBC) and Serum Iron Assay kit (abcam, ab239715). A, serum iron concentration. B, total iron-binding capacity (TIBC). C, % of saturation of transferrin. D, serum transferrin concentration. Values are expressed as mean ± SEM. Significance was determined by two-way ANOVA test. *P < 0.05, **P < 0.01, ***P < 0.0001.